
Hello, and welcome to this video about tree diagrams! Today we’ll learn how to use tree diagrams to help us answer probability questions. We’ll also learn how to create tree diagrams to represent real-world scenarios.
Reviewing the Basics
Before we get started, let’s review a few things.
Probability
First, probability is a branch of mathematics that deals with how likely an event is to occur. It’s represented by a number between 0 and 1, with 0 meaning that the event is impossible to occur and 1 meaning it will definitely occur. The closer the probability is to 1, the more likely the event is to occur.
Independent Events
Some probability events are independent. Independent events are not affected by the outcomes of previous events. A common example of an independent event is a coin toss. Each flip of the coin is an isolated event. The outcome, heads or tails, does not depend on the previous coin tosses.
Dependent Events
Other probability events are dependent, meaning that the outcome depends on what happened in a previous event. For example, consider a set of playing cards with 4 face cards and 2 numbered cards. Without looking at the cards, what are the chances of selecting a numbered card? The probability is 2 in 6. There are 2 numbered cards with 6 cards total.
If the selected card gets taken out of the deck, then the probability of the next event changes. Since there is one less card, there are now 5 cards total. In this instance, what are the chances of selecting a numbered card? Since there are 2 numbered cards and 5 cards total, the chances are 2 in 5. Notice that the probability changes as a result of removing one card in the first instance. In other words, the probability depends on a previous event.
Tree Diagrams
Now that we understand the basics, let’s talk about tree diagrams. Tree diagrams are a tool to help us visualize probability in sequences of events. They can illustrate both dependent and independent events.
Example #1
Let’s look at a tree diagram for a single coin toss.
In this tree diagram, we see two branches representing the 2 possible outcomes in a coin toss. The probability is written on each branch as a decimal between 0 and 1. The outcomes, heads or tails, are written at the end of each branch. Since there’s a 50% chance the coin lands on heads and a 50% chance it lands on tails, the probability of both outcomes is 0.5.
Example #2
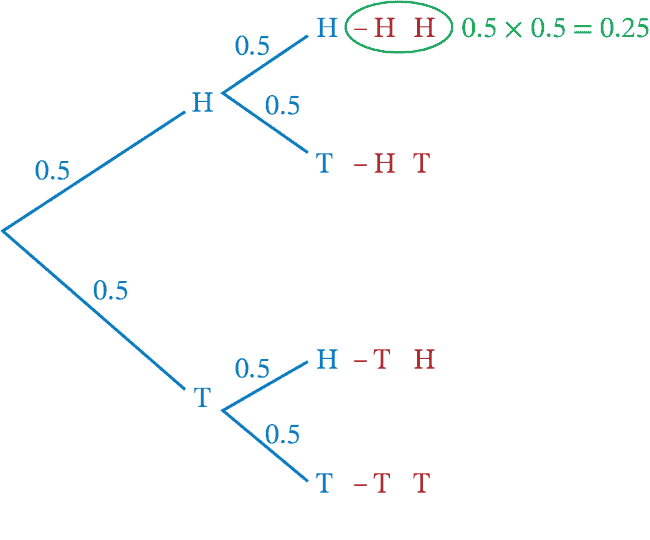
Let’s extend the tree diagram to include 2 coin tosses.
As you can see, we added two more branches to each original branch to represent the second coin toss. After an initial coin toss of heads, the second coin toss could be heads or tails. After an initial coin toss of tails, the second coin toss could be heads or tails. In the second coin toss, there is a probability of 0.5 for the coin landing on heads and a probability of 0.5 for the coin landing on tails.
To clarify the sequence of events, write the outcome of both coin tosses at the end of each branch.
To calculate overall probabilities for each of the 4 outcomes, multiply probabilities along the branches. For example, the probability of flipping heads twice is \(0.5\times 0.5\), which equals 0.25.
Continue multiplying by following along each set of branches and record the overall probabilities next to each outcome.
As you can see, the probability of each outcome for two coin tosses is 0.25. Check your work by finding the sum of the overall probabilities, which should always add up to 1.
To summarize, when calculating overall probabilities for each series of events, multiply along the branches. To check your work, find the sum of the overall probabilities, which will always equal 1.
Coin Toss Examples
Now it’s your turn. Analyze the tree diagram given for 3 coin tosses, and use it to answer the following questions:
- How many overall outcomes are possible with 3 coin tosses?
Based on the tree diagram, there are 8 overall outcomes possible with 3 coin tosses:
- Heads, Heads, Heads
- Heads, Heads, Tails
- Heads, Tails, Heads
- Heads, Tails, Tails
- Tails, Heads, Heads
- Tails, Heads, Tails
- Tails, Tails, Heads
- Tails, Tails, Tails
- What is the probability of flipping tails, heads, and tails again?
The probability of flipping tails, heads, tails is 0.125. Multiply by following along the set of branches for this scenario, as shown. \(0.5\times 0.5\times 0.5=0.125\).
- What is the probability of flipping tails exactly 1 time with 3 coin tosses?
This question is a little more difficult. First, identify how many overall outcomes contain exactly 1 tails flip. Based on the tree diagram, we see that there are 3 outcomes with exactly 1 tails flip.
Next, multiply along the branches for each scenario to find the overall probability for each outcome. Since \(0.5\times 0.5\times 0.5=0.125\), each outcome has a probability of 0.125.
Last, find the sum of the overall probabilities with exactly 1 tails flip.
\(0.125+0.125+0.125=0.375\), so the probability of flipping tails exactly 1 time with 3 coin flips is 0.375.
Nice work!
Real-World Examples
Tree diagrams aren’t only used in the math classroom. They’re used all the time in the real world. For instance, sports analysts use tree diagrams to help calculate the outcome of games. Insurance companies use tree diagrams to determine the best policy, depending on risk factors and coverage provided. Additionally, meteorologists use tree diagrams to help forecast the weather based on the past several days. As you can see, tree diagrams are used all the time.
Now that we understand how to interpret tree diagrams, let’s practice creating tree diagrams to represent a given scenario.
- A soccer team has 2 games coming up. The probability of the team winning is 0.5. The probability of the game ending in a tie is 0.3. Create a tree diagram to represent this scenario.
Start constructing the tree diagram by drawing branches to represent the first set of events in the scenario. What are the possible outcomes for the first soccer game? The team could win, tie, or lose.
Next, label the branches with the probabilities given in the problem. Notice that the problem doesn’t tell the probability of the team losing the game. Recall that the sum of the probabilities has to equal 1. \(0.5+0.3=0.8\). Therefore, the probability of losing the game has to be 0.2 because \(0.8+0.2=1.0\).
From here, draw the next set of branches for the second set of events in the scenario. What are the possible outcomes for the second soccer game? Once again, the team could win, tie, or lose.
Next, label the second set of branches with their corresponding probabilities.
Now that we’ve represented the results of the 2 soccer games on a tree diagram, let’s find the overall probabilities of these scenarios. Multiply along the branches for each scenario to find the overall probability of each outcome.
Check your work by finding the sum of the overall probabilities in the column to the right.
The sum of these values is equal to 1, so the overall probabilities are correct.
Now it’s your turn. I’m going to give you one more scenario. You’re going to create a tree diagram and use it to help you answer some questions. This one is a little more challenging, but I know you can do it.
- Jacob is traveling by train on Monday and Tuesday. The probability that the train arrives late is 0.1. The probability that the train arrives exactly on time is 0.4. The probability that the train arrives early is 0.5.
First, create a tree diagram to represent this scenario.
Start by drawing branches to represent the first set of events in the scenario. On Monday, the train could be late, on time, or early. Next, label the branches with their corresponding probabilities. From here, draw another set of branches for the second set of events in the scenario. On Tuesday, the train could be late, on time, or early.
Next, label the second set of branches with their corresponding probabilities. Then, multiply along the branches to find the overall probability of each outcome. Check your work by finding the sum of the overall probabilities, which should be equal to 1.
Now ask yourself: Which scenario is most likely to occur?
The scenario that is most likely to occur is the set of events with the highest overall probability. The highest overall probability is 0.25, representing the likelihood of the train arriving early on both Monday and Tuesday. Therefore, this is the most likely scenario.
What is the overall probability of the train arriving early or exactly on time on both Monday and Tuesday?
First, identify the scenarios in which the train is either early or on time for both days. There are 4 scenarios where this is true. Next, find the sum of the overall probabilities with the trains either early or exactly on time. When you add these values together, you get 0.81 (\(0.16+0.2+0.2+0.25=0.81\)). Therefore, the overall probability of the train arriving either early or exactly on time for both days is 0.81.
Great job!
I hope this video about tree diagrams and probability was helpful. Thanks for watching, and happy studying!
Tree Diagram Practice Questions
A gym teacher has a circle spinner with 4 equal sections. The sections represent push-ups, crunches, sprints, and jumping jacks. The gym teacher spins the circle spinner twice in order to select two exercises for the class. What is the probability of the class doing only jumping jacks, crunches, or a combination of the two? Use a tree diagram to help you solve this question.
In a tree diagram, there are four possible pathways that include jumping jacks, crunches, or both jumping jacks and crunches.
The possible options are: crunches then crunches, crunches then jumping jacks, jumping jacks then crunches, and jumping jacks then jumping jacks.
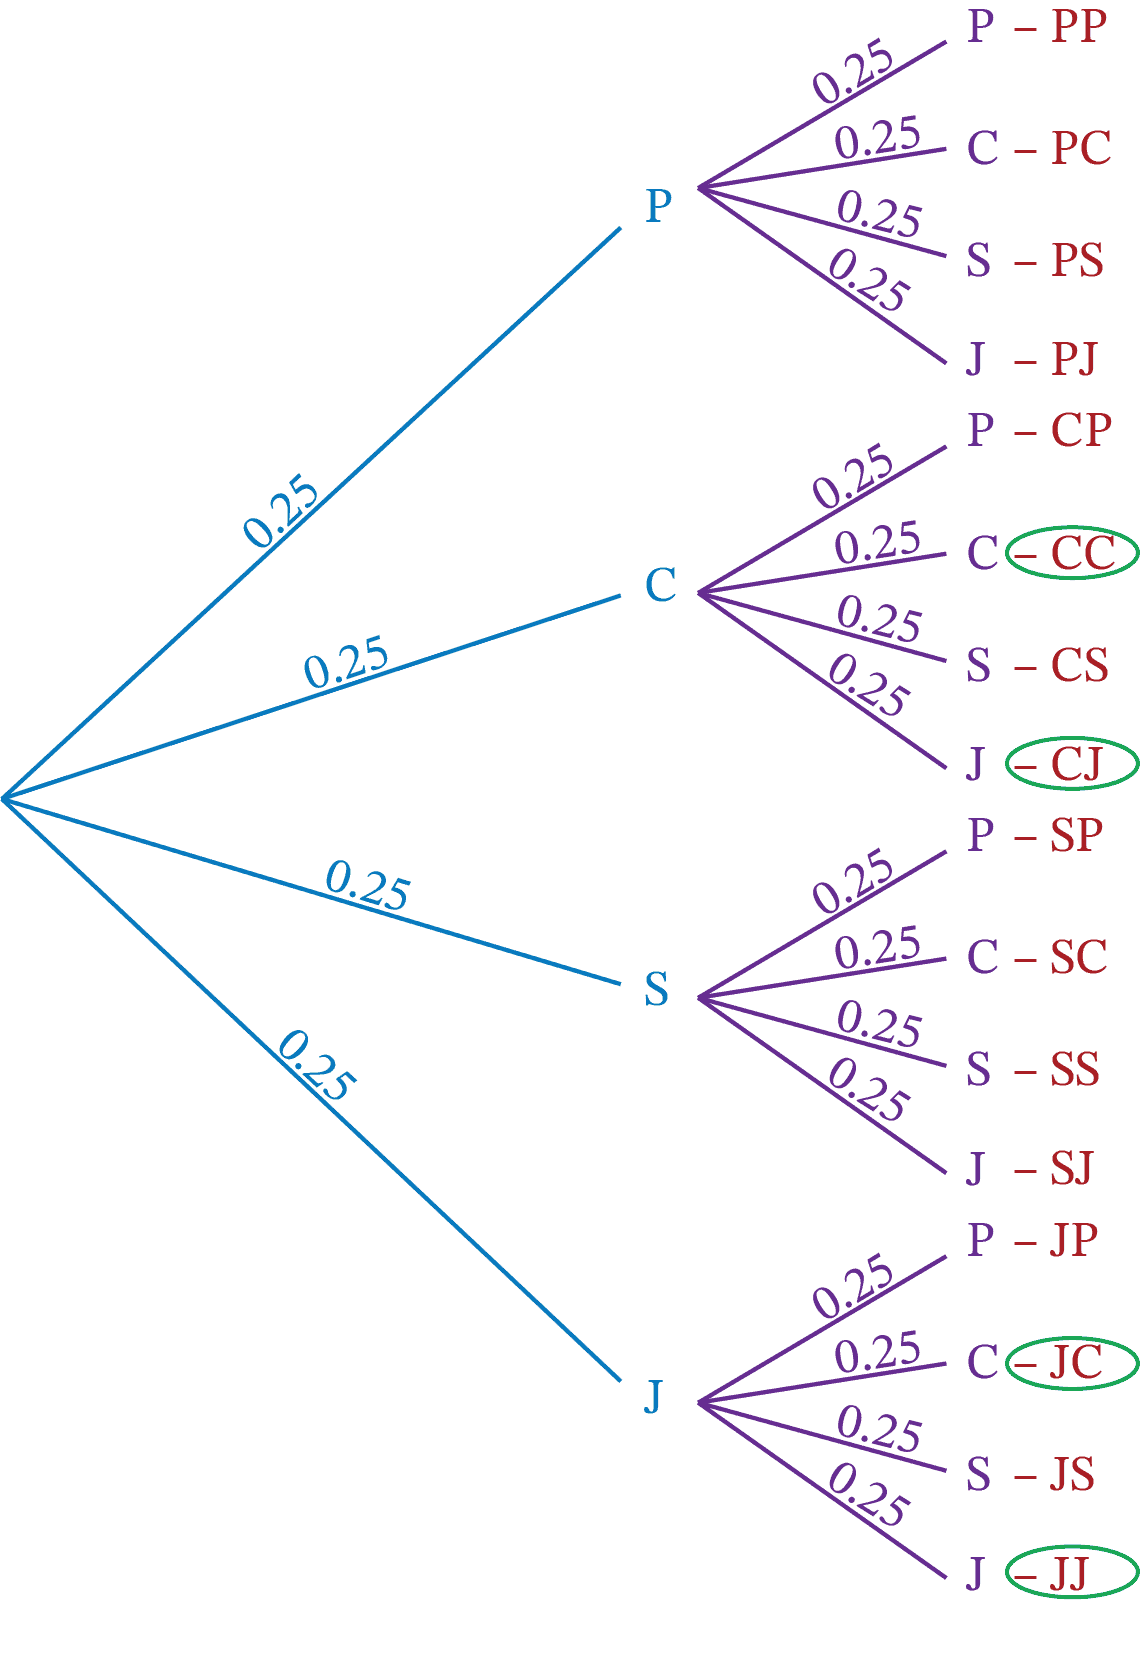
There is a probability of 0.25 for each activity, so multiply \(0.25\times0.25\) to calculate the probability of each pathway.
C then C: \(0.25\times0.25=0.0625\), which is a probability of 6.25%
C then J: \(0.25\times0.25=0.0625\), which is a probability of 6.25%
J then C: \(0.25\times0.25=0.0625\), which is a probability of 6.25%
J then J: \(0.25\times0.25=0.0625\), which is a probability of 6.25%
To find the probability one of the combinations will occur, add the probabilities: \(6.25\%+6.25\%+6.25\%+6.25\%=25\%\)
There is a 25% chance the class will do jumping jacks, crunches, or a combination of the two.
A circular spinner has 3 sections: red, green, and blue. The red section represents \(\frac{1}{5}\) of the circle. The green section represents \(\frac{1}{2}\) of the circle. What is the probability of the spinner landing on blue?
The red section represents \(\frac{1}{5}\), or 0.2, of the circle. The green section represents \(\frac{1}{2}\), or 0.5, of the circle. Together, these sections represent \(0.2+0.5=0.7\) of the circle. The full circle is 1.0, or all of the probabilities combined. To find the probability of the spinner landing on blue, subtract 0.7 from 1.0: \(1.0-0.7=0.3\).
0.3 as a percent is 30%, so there is a 30% chance the spinner will land on blue.
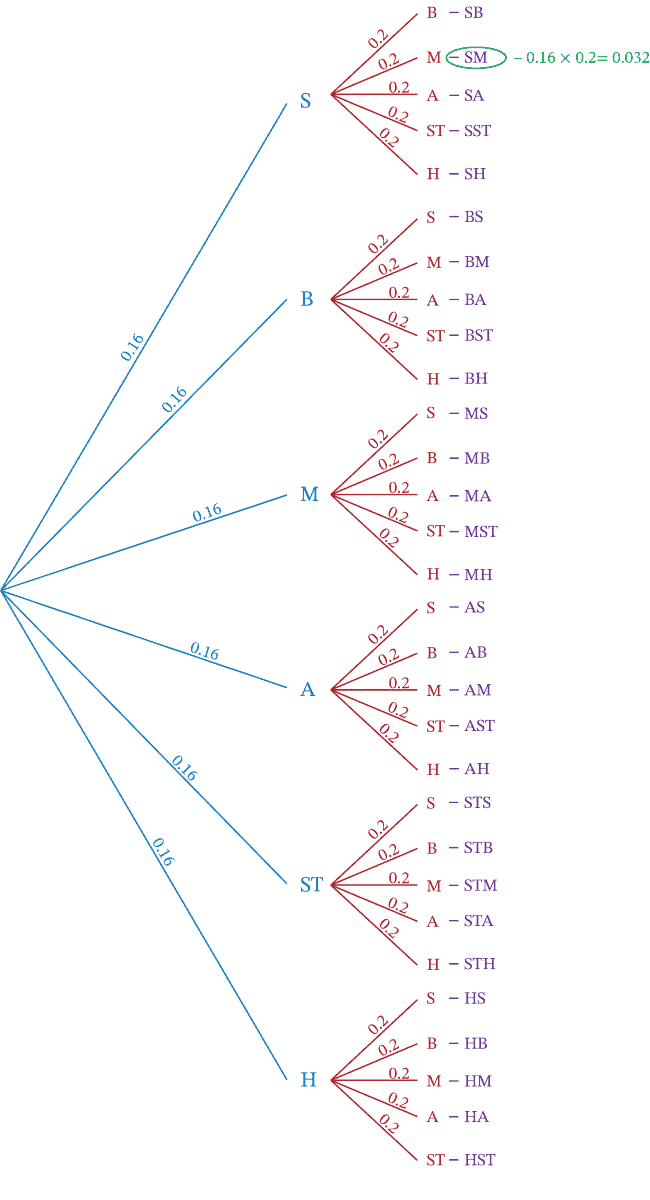
Desmond is planning a vacation for his family. He wants to surprise his family by selecting two vacation activities at random. Desmond writes six vacation activities onto small identical slips of paper and then places the slips of paper into a bag. The vacation activities include skydiving, beach day, art museum, aquarium, sailing tour, and horseback riding.
Desmond’s daughter selects two activities from the bag (without replacing the slip of paper back into the bag). What is the probability of Desmond’s family going skydiving and then visiting the art museum?
The probability of selecting skydiving first is 1 out of 6, or approximately 0.16. Now there are only 5 slips of paper left in the bag. Now the probability of selecting the art museum is 1 out of 5, or 0.2. Multiply the two probabilities to determine the probability of drawing skydiving then art museum. \(0.16\times0.2=0.032\), which is 3.2%.
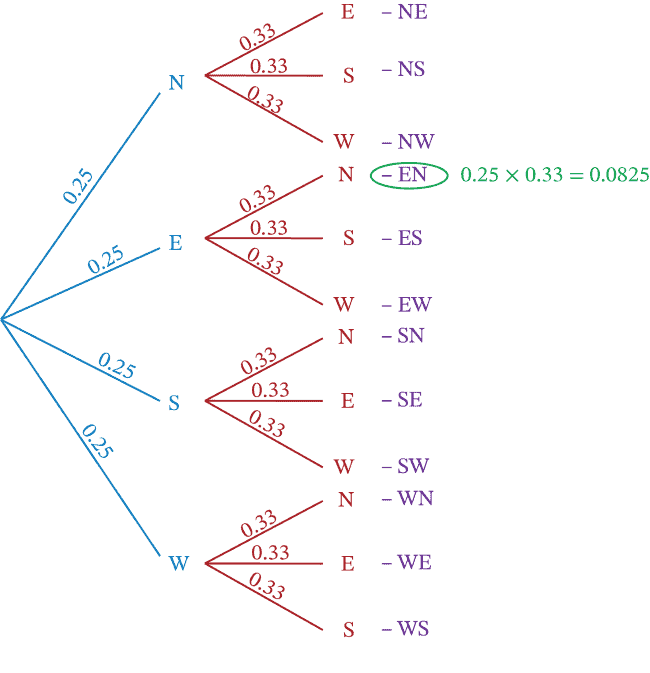
During an outdoor education class, a group of students are learning to navigate by using a compass. The students start at the same location, and make two direction shifts: north, south, east, or west. The students use a program that randomly generates a direction to determine their direction shift. The program will not generate the same direction twice in a row. For example, west and then west is not allowed. What is the probability that a student will move east and then north?
The probability of moving east and then north can be determined by setting up a tree diagram. The first set of branches will have four branches, each with a probability of 0.25. Since repeats are not allowed, three new branches will extend from each of the existing branches. These new branches will have a probability of \(\frac{1}{3}\), or approximately 0.33.
The pathway from east to north can be calculated by multiplying the two probabilities: \(0.25\times0.33=0.0825\), or 8.25%.
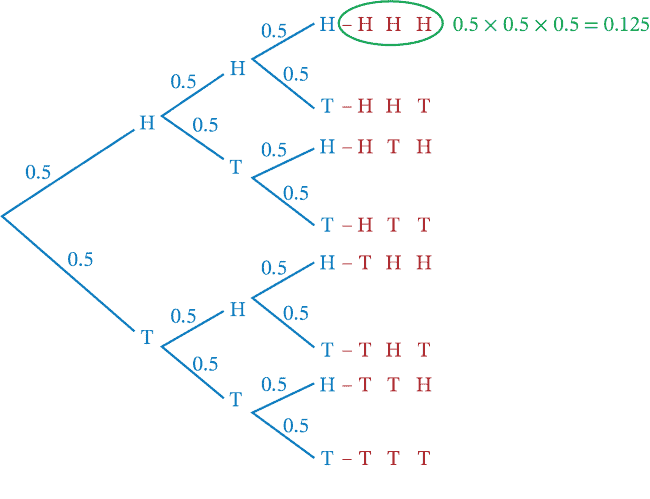
A coin shows heads on one side and tails on the other side. Is there a difference in the probability of flipping three heads in a row for a three-round game, and the probability of flipping two heads in a row for a two-round game?
The probability of each scenario can be determined by setting up two tree diagrams.
When you flip a coin three times, there will be one pathway for flipping heads, heads, heads. Each pathway has a probability of 0.5. Multiplying the pathway for heads, heads, heads results in \(0.5\times0.5\times0.5=0.125\). This means the probability of flipping heads, heads, heads is 12.5%.
When you flip a coin twice, there will also be one pathway for flipping heads and then heads. Each pathway has a probability of 0.5. Multiplying the pathway for heads and then heads results in \(0.5\times0.5=0.25\). This means the probability of flipping heads and then heads is 25%.
The probabilities are not the same.


