I’ve been experimenting over the last couple of weeks trying to make the perfect cup of coffee. Each week, I try to tweak one thing to see if I can get the flavor I’m looking for. I’ll either adjust how much coffee I use, how coarse the grind is, or how much water I add.
This week, I ground the beans, put two scoops of coffee in the filter, added four cups of water, and then pressed “brew” and waited for the magic to happen.
I’m experimenting to achieve the perfect cup, and all these elements in my experiment are what we call variables.
In this video, we’re going to break down what variables are, explore the difference between independent and dependent variables, and see how they show up in science and in life. By the end of this video, you should have a clear grasp of variables and the ability to identify them everywhere.
What is a Variable?
Let’s start with the basics. What exactly is a variable?
A variable is anything that can change or vary in an experiment or situation. If something can change, it has variance, which means it is a variable.
It’s a super broad definition, right? It encompasses most of the things around us. No need to get overwhelmed though; let’s go back to my cup of coffee to see variables more clearly.
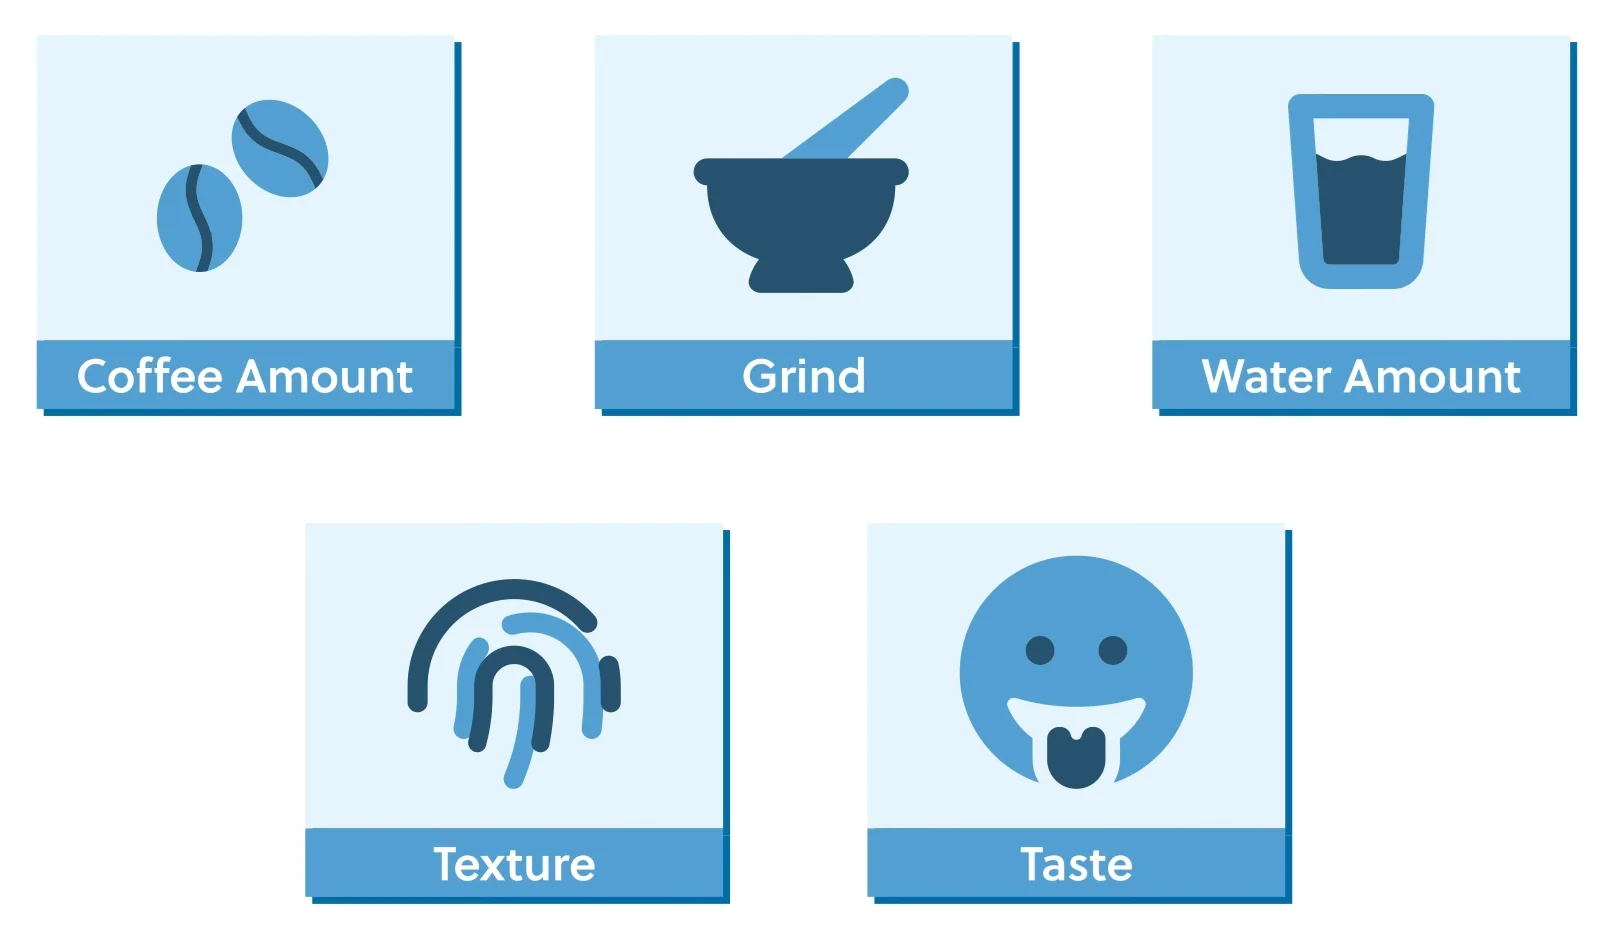
In my daily coffee experiment, we have a few variables at play: the amount of coffee, the grind, and the amount of water. The taste and texture of the coffee were other variables — sometimes it was bitter and watery, sometimes it was smooth and rich.
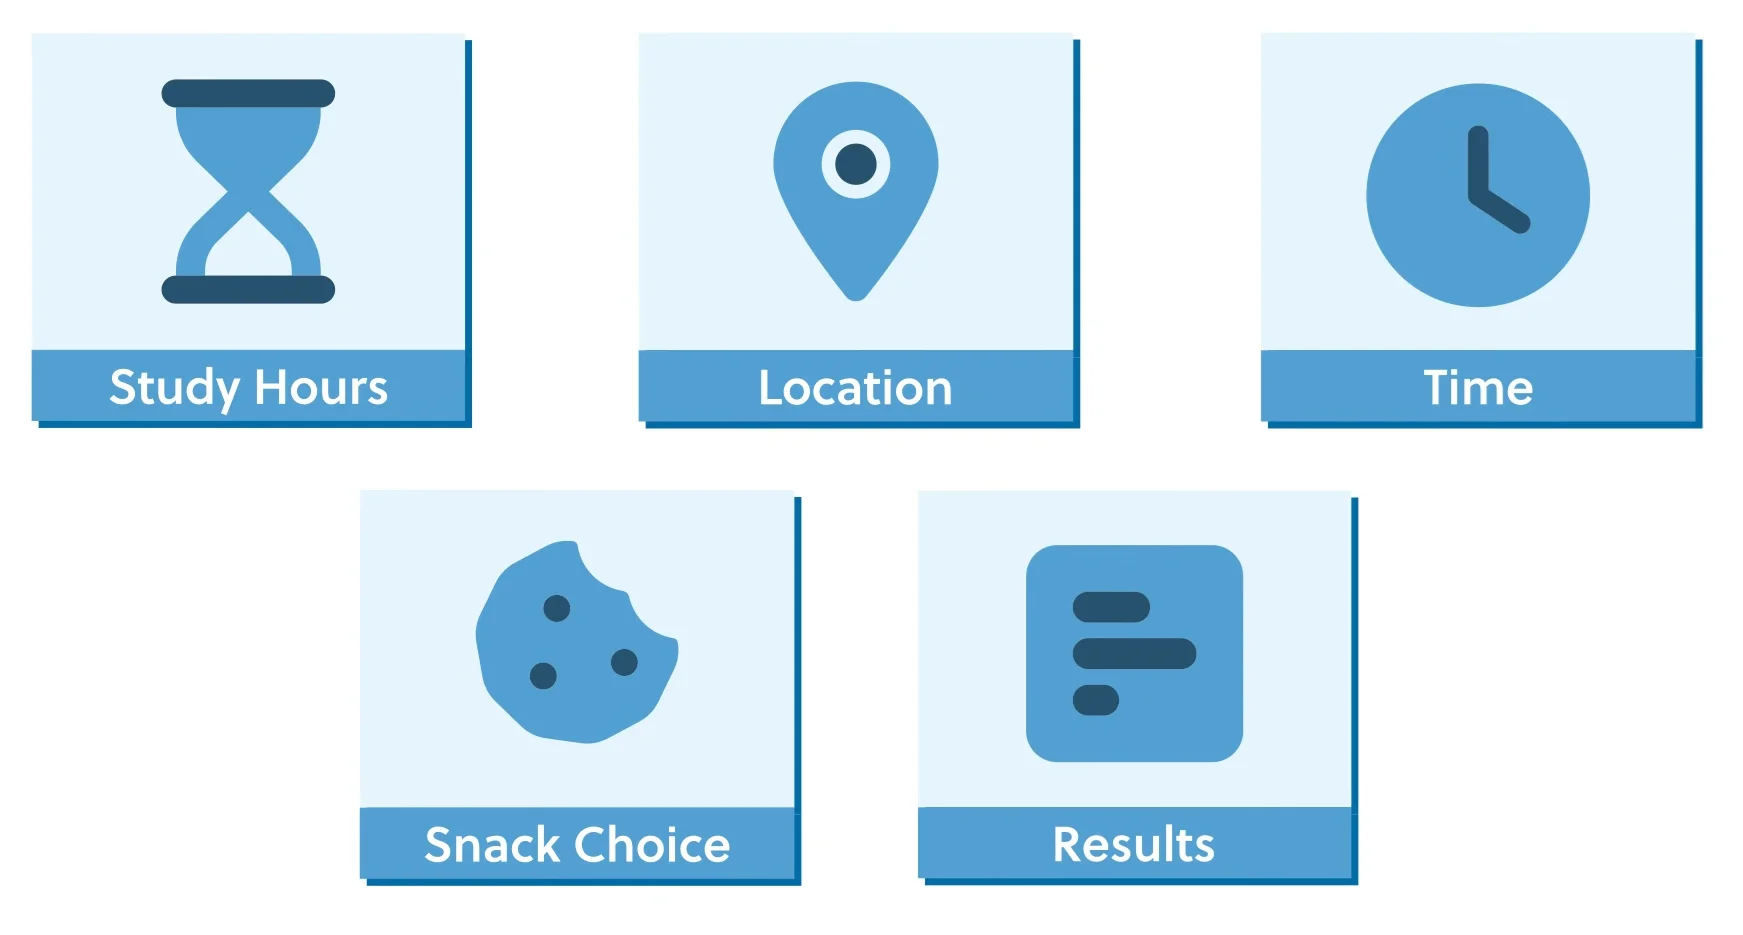
Think about your study habits—variables are at play there as well. The number of hours you study could be a variable, so could your choice of location, the time of day you hit the books, or even the snacks you eat while cramming. The results of your tests are also a variable.
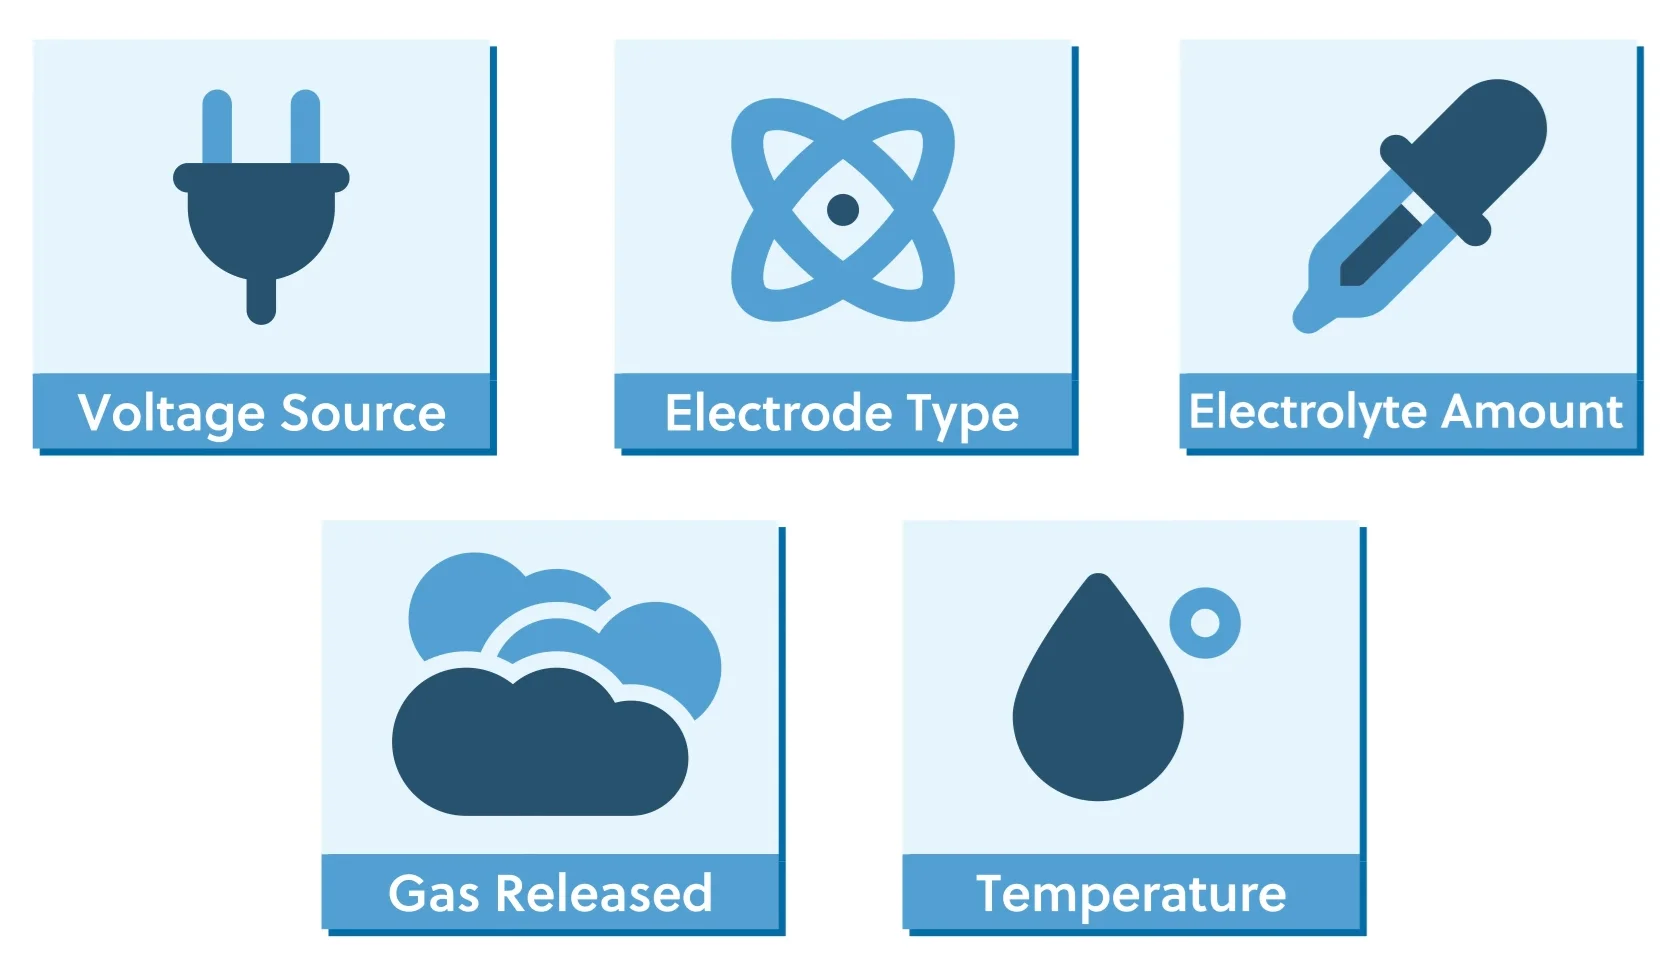
Now how does this relate to science? One of my favorite experiments from science class was electrolysis of water; we used a battery to separate water into its base components. The variables here were the voltage power source, the type of electrodes used for conduction, and how much electrolyte was added to the water to increase conductivity. The amount of hydrogen and oxygen gas that was released and the temperature of the water were also variables.
But not all variables are created equal, and a key part of understanding variables is seeing that there are two types: independent and dependent variables.
Independent Variables
Let’s start with independent variables. This is the variable that you, as the experimenter, get to control. The independent variable is NOT affected by other variables; that’s why it is called the *independent variable*.
In making the perfect cup of coffee, the amount of coffee I add to the machine is an example of an independent variable. I have control of how much coffee to add.
Do you know about Benjamin Franklin’s legendary kite experiment? In 1752, he constructed a kite out of a handkerchief and attached a conductive wire to the top of the kite to act as a lightning rod, along with a metal key and a Leyden jar. He then flew the kite during a thunderstorm.
Franklin noticed that when he moved his hand near the key, he felt a spark, proving that the kite had collected electrical charge from the storm clouds. The success of the experiment taught us a lot about electricity and directly led to the creation of the lightning rod.
In this experiment, the independent variables could include the kite’s construction materials and the weather conditions chosen.
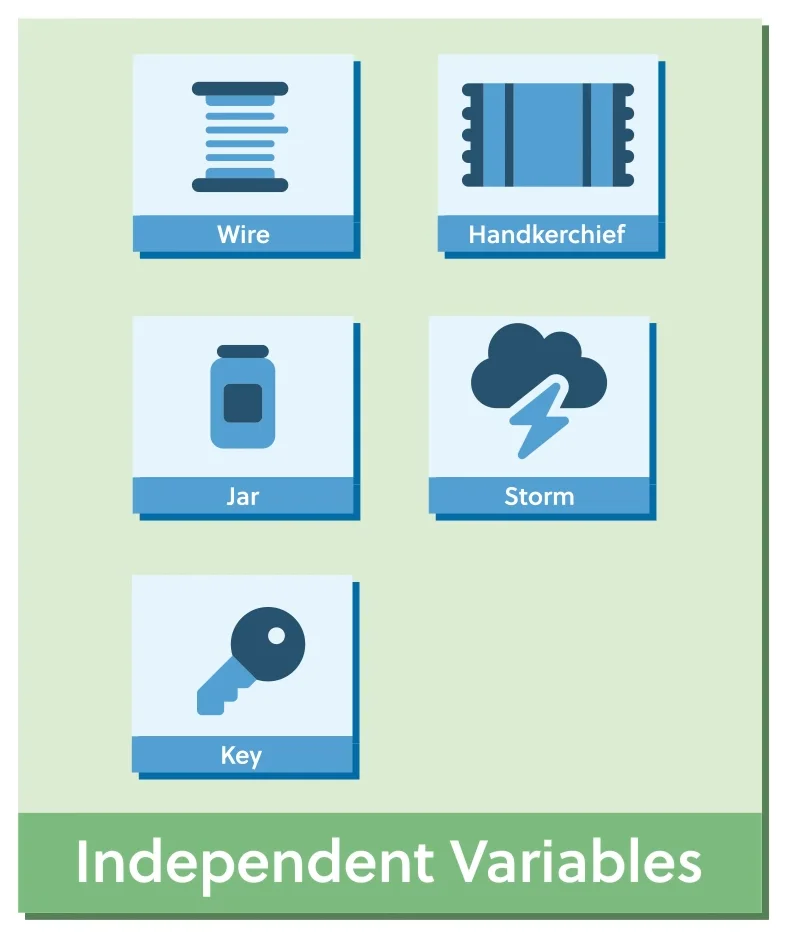
By manipulating these independent variables, Franklin could observe their effects on the dependent variables, leading to his insights about electricity
Remember, the independent variable is the one you’re manipulating or changing on purpose. It’s the cause in your cause-and-effect relationship.
Dependent Variables
So if independent variables are what we control, or the cause in the cause-and-effect relationship, then how do we explain dependent variables?
The dependent variable is the effect. It’s what changes as a result of what you did to the independent variable.
If the independent variables in my coffee experiment are how much coffee and water I add, then the main dependent variable is the taste of the coffee.
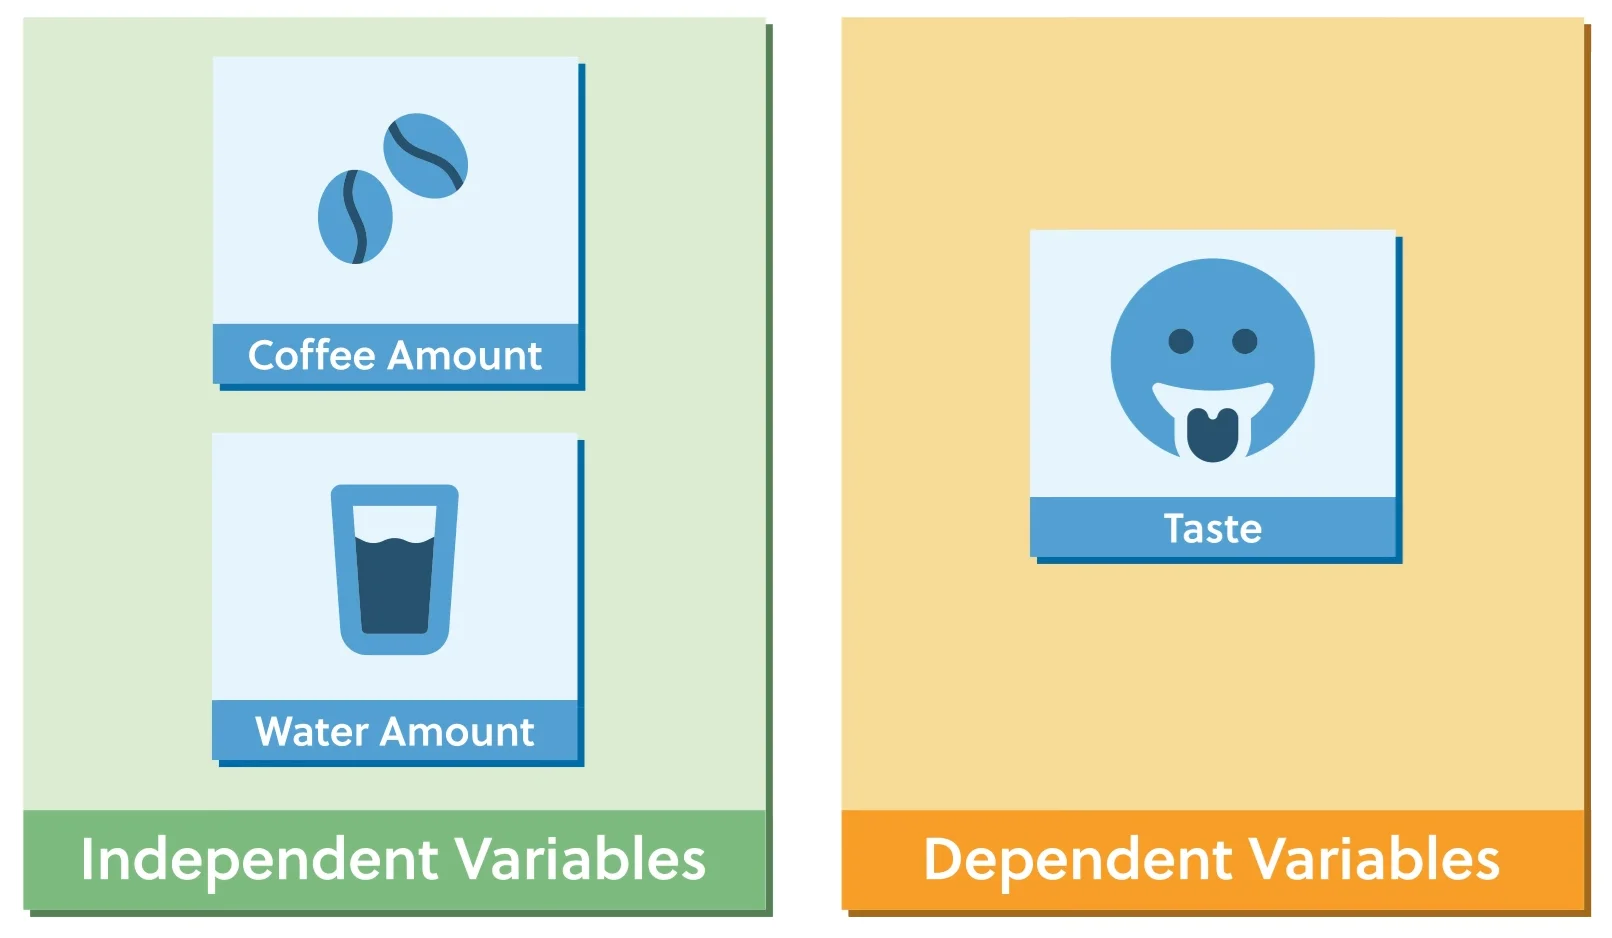
The quest for the perfect cup of coffee is about the manipulation of the independent variables to get the desired dependent variable.
Let’s talk about the Ben Franklin experiment again: the dependent variable in this case was the presence and intensity of the spark observed and the amount of electrical charge collected.
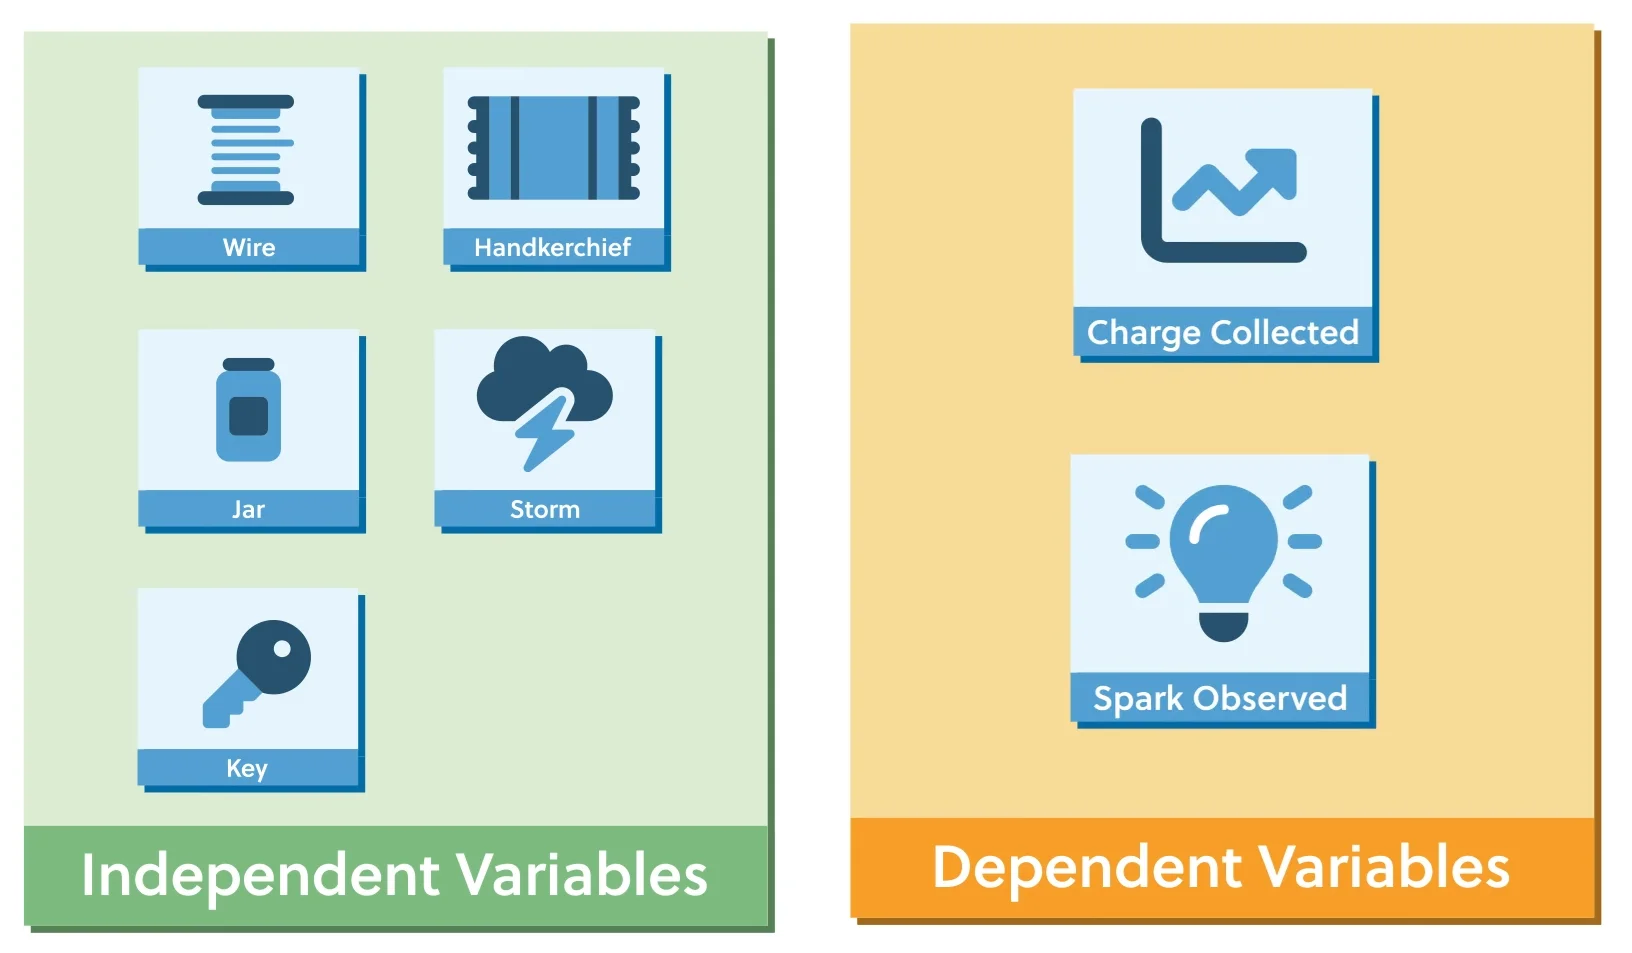
The key to identifying the dependent variable is to ask yourself, “What’s changing as a result of what I’m doing?” That’s your dependent variable.
How to Remember Variables
A quick way I like to think about these variables is through the letters ICDE. It stands for “Independent is the Cause. Dependent is the Effect.”
A more visual way to think about variables is through the domino effect. The independent variable is the first domino you push, and all the dominoes that fall afterward represent the dependent variable.
Now that you know all about independent and dependent variables, let’s talk about why this matters.
The Scientific Method
Let’s talk about the scientific method. The scientific method is the approach by which scientists acquire, correct, and integrate knowledge. We don’t have to go into specifics about the method in this video, but what you have to know is that variables are a fundamental part of the scientific method.
The cause-and-effect relationship of variables is what helps scientists formulate experiments to test their hypotheses and draw conclusions from the results observed.
All scientific breakthroughs, from the discovery of gravity to the structure of DNA, have resulted from constantly experimenting by manipulating the independent variable and observing and understanding how they impact the dependent variable.
The best part of understanding variables and how important they are in the scientific method is that you can apply this to everyday life, even if your career is not in the sciences.
Review
So, to sum it up: The independent variable is what you can manipulate and is not impacted by other variables. It’s the cause. A dependent variable is what is observed as a result of the changes to the independent variables. It’s the effect.
The independent is the cause, the dependent is the effect.
Let’s put your knowledge to the test:
Let’s say you want to sleep better. You plan to change your bedtime, change your screen habits, and change the time of your last meal of the day. Your hope is that this will have a noticeable impact on sleep quality.
Which of the following accurately describes an independent and dependent variable found in our example?
- Bed time; Sleep quality
- Sleep quality; Screen habits
- Last meal time; Bed time
- Sleep quality; Last meal time
The time you go to bed would be an independent variable, which would affect your sleep quality, which is a dependent variable.
All right, that’s all for now. Thanks for watching, and happy studying!
Independent and Dependent Variable Practice Questions
Carlos is developing a new chocolate chip recipe. While testing recipes out, he notices that when he adds less and less flour to the cookie dough, the cookies get wider and spread out on the pan. What is the dependent variable in Carlos’ experiment?
Remember that the dependent variable depends on the independent variable. In this problem, we see that the width (a.k.a. the “size”) of each cookie depends on how much flour Carlos puts in the dough.
*Another helpful rule to memorize is: the dependent variable is what we observe (or measure) happening in an experiment. But, as for the independent variable, it is usually what we change in an experiment. In this problem, the independent variable is the amount of flour that Carlos adds to the dough.
A local gardening club has started a new compost bin, and they begin by putting a small number of worms in the starter soil. Every week, they open the bin and count how many worms are working through the compost. Using this information and the graph below, choose which measurement is the independent variable.
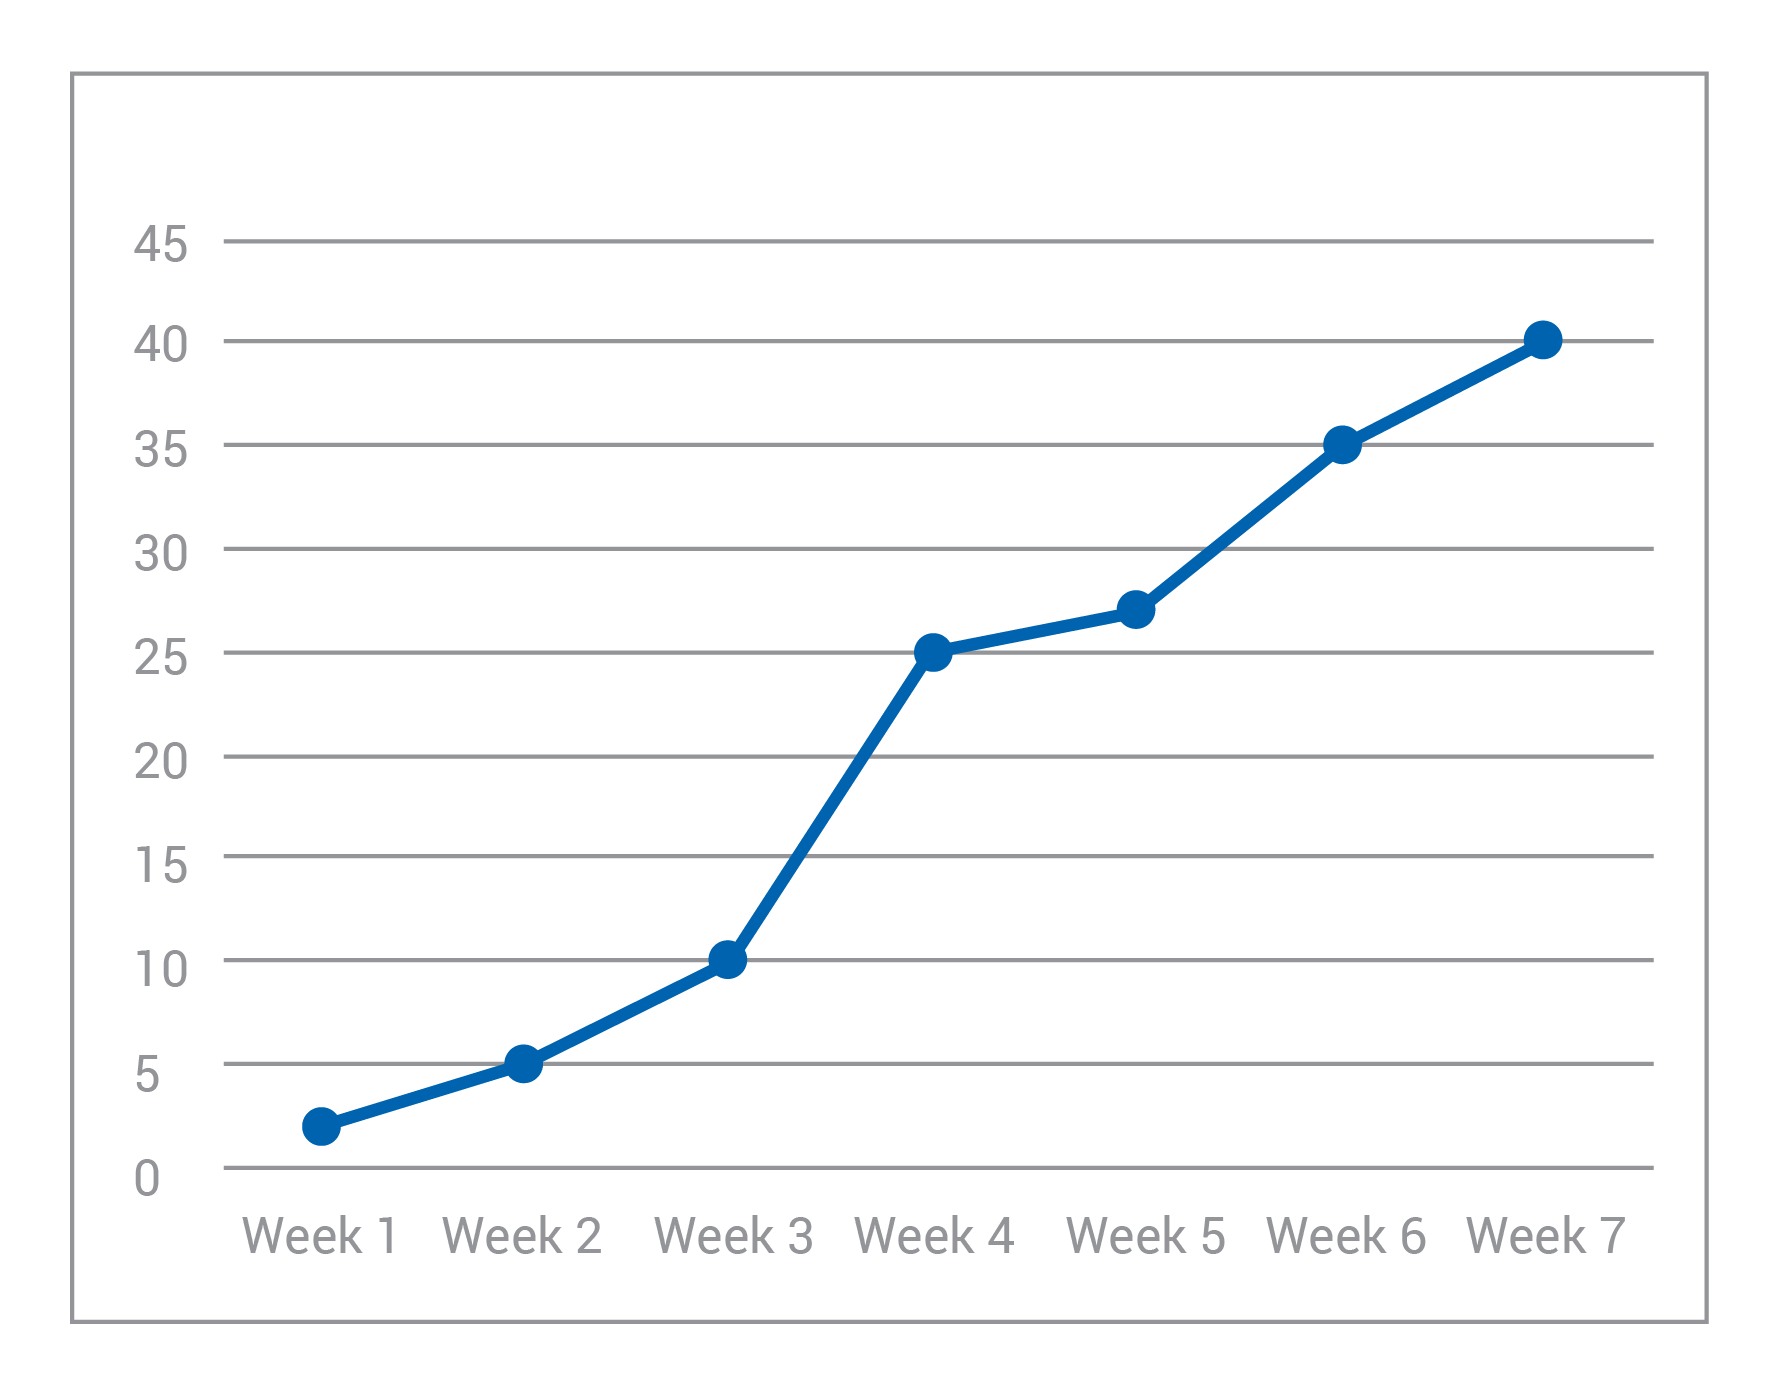
The correct answer is A. While we may not be making time go on or changing time itself, we see that the amount of worms grows as time goes on. Hence: the worm population depends on how much time has passed.
*Also, even if we didn’t fully understand what was going on in this experiment, we can count on two “cheat cards:” time is almost always an independent variable; and we usually put the independent variable on the x-axis and the dependent variable on the y-axis when graphing experiment results.
You’ve been given the equation \(q=7.4p^2+9\) and the table:
| (input)\(p\) | 2 | 4 | 6 | 8 | 10 | 12 | 14 | 16 |
| (output)\(q\) | 39 | 129 | 279 |
Using this information, we can deduce that the dependent variable is most likely _____.
The correct answer is C. If we were only given the equation \(q=7.4p^2+9\), we couldn’t decide which variable depends on the other (because we could easily re-write the equation as \(p=\sqrt{\frac{q-9}{7.4}}\)). However, because we know that p is the input-value and q is the output-value, we also know that q depends on p. (What we pull out depends on what we put into the equation.) Also, since we’ve already been given pre-set values of p, it’s safe to assume that p is the independent variable; because the value of p will not be impacted by a change in q.
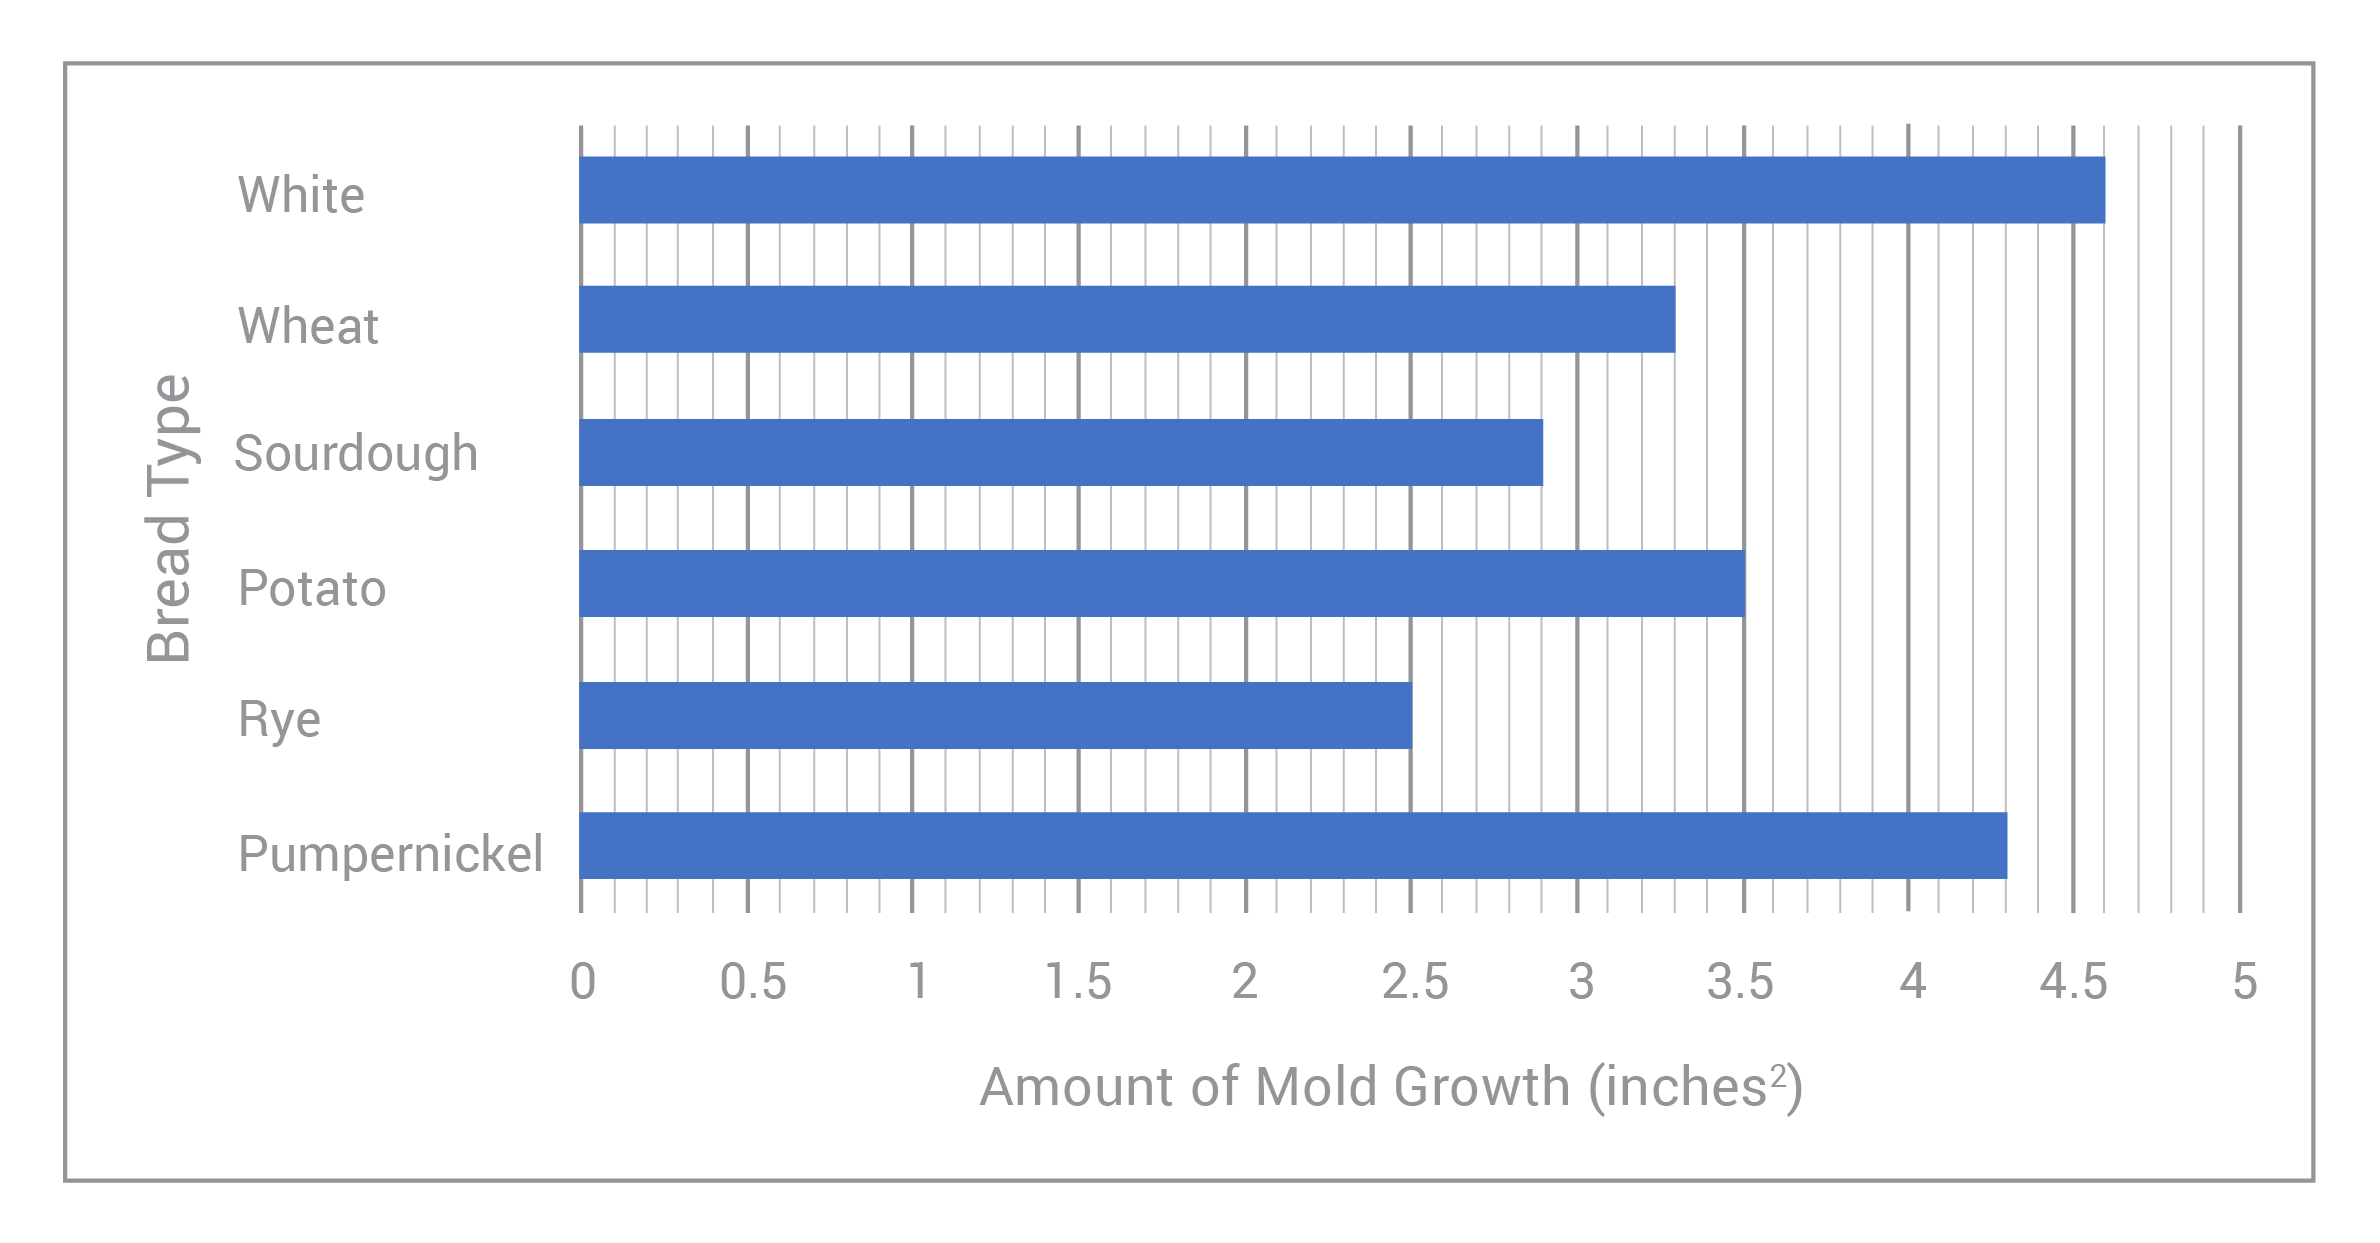
Over the past few weeks, Briana has been conducting an experiment to see what type of bread grows the most mold within a given period of time. She’s chosen 6 different types of bread, and as time has passed, she’s measured the areas of each mold patch that’s grown on the respective bread slices. The graph below shows her results:
What is the independent variable in Briana’s experiment?
The correct answer is B. While it may be tempting to choose Choice A, time is actually a controlled variable (the “control”) in this experiment. We observed a phenomenon over a pre-set, controlled period of time. Really, we need to ask ourselves, “What is Briana changing?” (this will always be our independent variable) and “What is she measuring/observing?” Of course, as Briana has changed the type of bread, she’s observed a change in the amount of mold grown on each slice; so it’s clear that our independent variable is the bread type!
*Additionally, Briana has noticed that the amount of mold growth on each slice is different for each type of bread. Hence, it’s safe to say that the ‘amount of mold growth’ depends on the ‘bread type.’ Meaning: the amount of mold growth is Briana’s dependent variable!
**One final note: notice that the dependent variable sits on the x-axis of this graph, and the independent variable sits on the y-axis. This is different from what we usually see! So, it’s important that we take the “x-axis=independent variable and y-axis=dependent variable” trick with a grain of salt. Always read the question and the graph labels carefully!
Mia is training for a marathon. As she reads through her food & fitness tracking journal, she notices that she runs more miles on the days where she eats an apple with breakfast. What is the dependent variable in this scenario?
The correct answer is A. In this problem, the amount of miles that Mia runs in a day depends on whether or not she eats an apple with her breakfast. We can also note that the independent variable is what Mia eats for breakfast. More specifically, it is whether or not she eats an apple with her breakfast.
