
Hi, and welcome to this overview of functions! In this video, we will be examining the nature of mathematical relationships between variables. As we work through some examples, our goal is to determine whether or not the criteria are met to define a special relationship known as a “function.”
The Basics of Relations
Let’s take some time to review the basics of math rules, or relations.
When we are working with an equation, the value of the variable \(x\) helps determine the value of the variable \(y\).
The \(x\)-value can be thought of as the input into the math rule that is determined by the equation, and the \(y\)-values that result are the output. The technical terms for all \(x\)-values and \(y\)-values are domain and range, respectively.
So in this equation, the range, \(y\), is going to be the same as \(2x+3\).
We can use a table to lay out some of the different outcomes of the equation.
| Domain | Range \(\hspace{20px}y=2x+3\) |
|---|---|
| \(-2\) | \(2(-2)+3= -1\) |
| \(-1\) | \(2(-1)+3=1\) |
| \(0\) | \(2(0)+3=3\) |
| \(1\) | \(2(1)+3=5\) |
| \(2\) | \(2(2)+3=7\) |
So we have our equation here, and the different values that \(x\) could be listed here. For instance, if we find that \(x\) is -2, our problem would look like \(2(-2)\) (which is -4), plus 3, which equals -1.
Ordered Pairs
A set of ordered pairs can also be used to show a mathematical relationship. The five elements of the domain and range from the table are shown here:
In words, each \(x\)-value is shown as an ordered pair with its corresponding \(y\)-value. These ordered pairs can be graphed on a coordinate plane to show the relationship visually.
The relation, \(y=2x+3\), is graphed here:
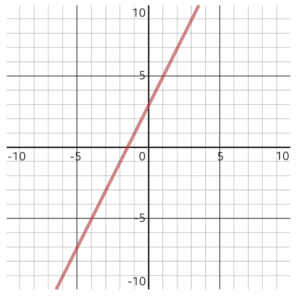
The domain values are found on the \(x\)-axis, and the graph takes shape according to the range values on the \(y\)-axis.
Mapping
Another convenient visual representation of a relationship is called a mapping, which shows a direct correspondence between the domain and range elements. Here are two examples:
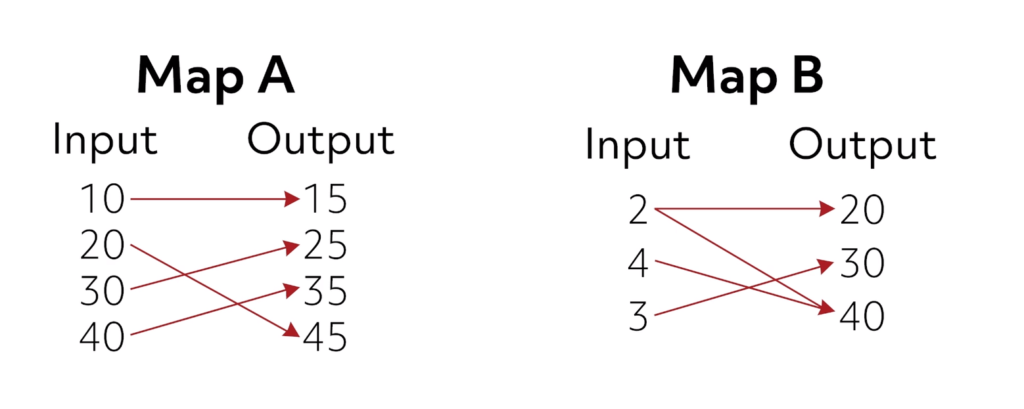
In Map A, each input value maps to one output value, but in Map B, the domain value “2” maps to two output values, 20 and 40. This simple image plainly shows the criteria to determine whether the relation given is a function.
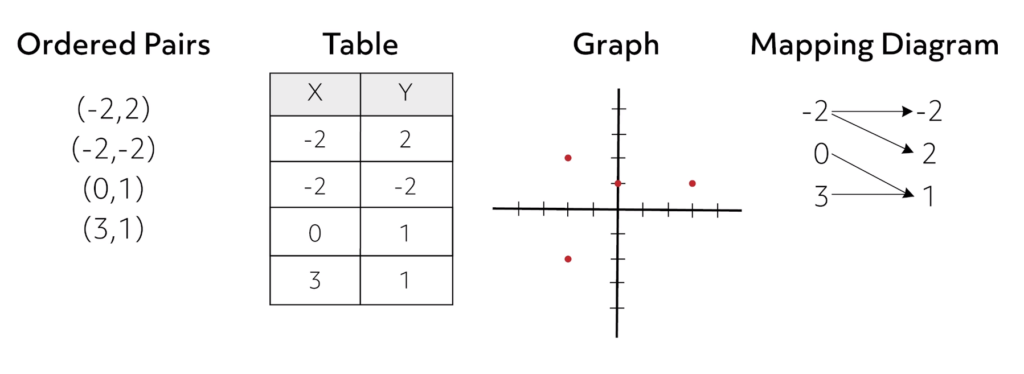
By definition, a relation is defined as a function if each element of the domain maps to one, and only one, element of the range. Not all relations are functions, but functions are a subset of relations. We have covered several representations of relations in this video. The following image shows four representations that show a relation that does not qualify as a function:
Vertical Line Test
At this point, we will focus on the graph of this relation to introduce the vertical line test, which allows you to quickly determine the function status of any graph that you are given.
In short, if you draw a vertical line through a graph and hit only ONE point, then that graph represents a function. In the example we just showed, if you draw a vertical line through the domain value of -2, the line will pass through range values of 2 and -2.
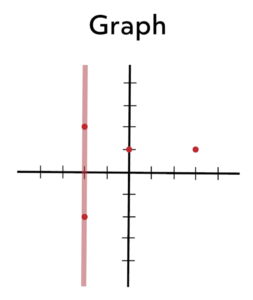
Therefore, the relation fails the vertical line test. Here are more examples of this convenient tool to determine a function from a graph.
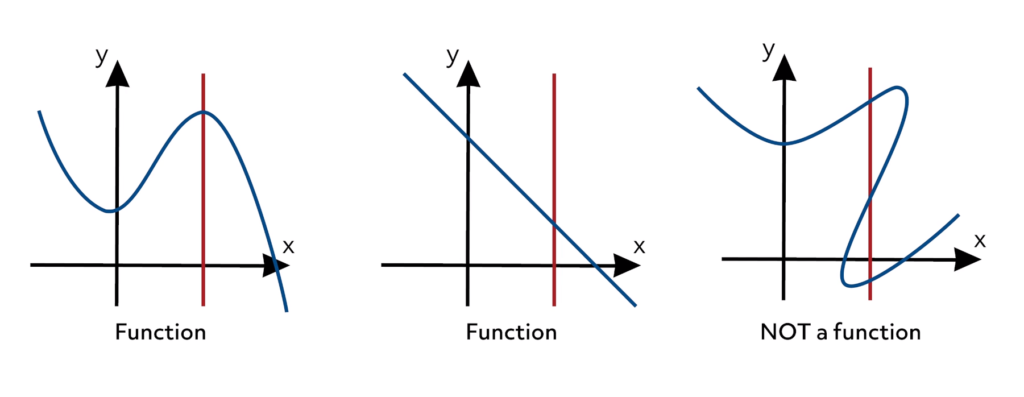
Think you’ve got the hang of it?
What is a Function?
Let’s go through a few problems together and see.
Is this a function?
In this set of ordered pairs, the domain values are \({-2, -3, -4}\) and the range values are \({2, 3, 4}\). Because each domain value is paired with only one range value, this relation is a function. What about this set?
In this set, the domain values are \({3, 2}\), and the range values are \({2, 3, 4}\). Because the domain value of 3 is paired with 2 and 3 in the range, this relation is NOT a function.
Here’s one more set to figure out:
What do you think? Is this a function or just a relation?
The domain of this relation is \({1, 2, 3, 4, 5}\) and the range is \({2}\). Because each element of the domain is paired with “2”, it satisfies the definition of a function. It is allowable for each element of the domain to pair with the SAME element of the range.
Remember the vertical line test? Which one of these graphs passes that test if we were to draw a vertical line through it?
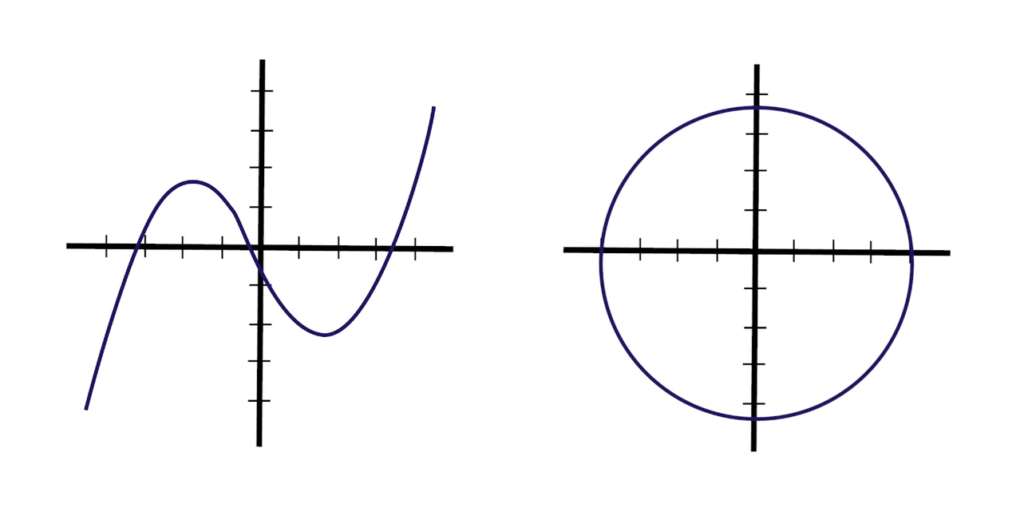
The first graph here passes the test, because the vertical line only passes through one point. In the second graph, the vertical line passes through two points, so it is not a function.
Now that we’ve gone through several different representations of functions, you should be well on your way to knocking out more complex equations down the road.
Thanks for watching, and happy studying!
Frequently Asked Questions
Q
What is a function in math?
A
A function is a relation where one quantity depends on the other.
Q
How do you find the domain of a function?
A
Find the domain of a function by considering what numbers could be inputs for the function.
Ex. What is the domain of \(f(x)=\frac{x+7}{x-3}\)?
A denominator can never be 0, so x can be any number except 3, or \(x=\frac{R}{3}\).
Q
How do you find the inverse of a function?
A
To find the inverse of a function, change f(x) or y to \(f^{-1}\) (x) and swap the positions of that and x. Then, solve for \(f^{-1}\) (x).
Ex. What is the inverse of \(f(x)=4x+1\)?
First, change f(x) to \(f^{-1}\) (x) and swap positions of that and x.
\(x=4f^{-1} (x)-1\)
Then, solve for \(f^{-1} (x)\).
\(x+1=4f^{-1} (x)\)
\(\frac{x+1}{4}=f^{-1} (x)\)
Q
How do you find the range of a function?
A
Find the range of a function by determining what the outputs of a function are.
Ex. What is the range of the function \(f(x)=x^2+x+4\)?
The range is [4,∞) because the lowest value of f(x) for any given x-value is 4, but f(x) can be any value greater than 4.
Q
What is a linear function?
A
A linear function is any function that graphs as a line.
Function Practice Questions
Which set of ordered pairs shows a relation that is a function?
By definition, a relation is a function if each element of the domain maps to only one element in the range. In other words, a relation is a function if each \(x\)-value has only one \(y\)-value. Looking at the relations in each choice, the only relation where the domain value (\(x\)-value) does not repeat is \((1,-3), (2,-4), \)\((0,2), (-1,5), (-2,8)\).
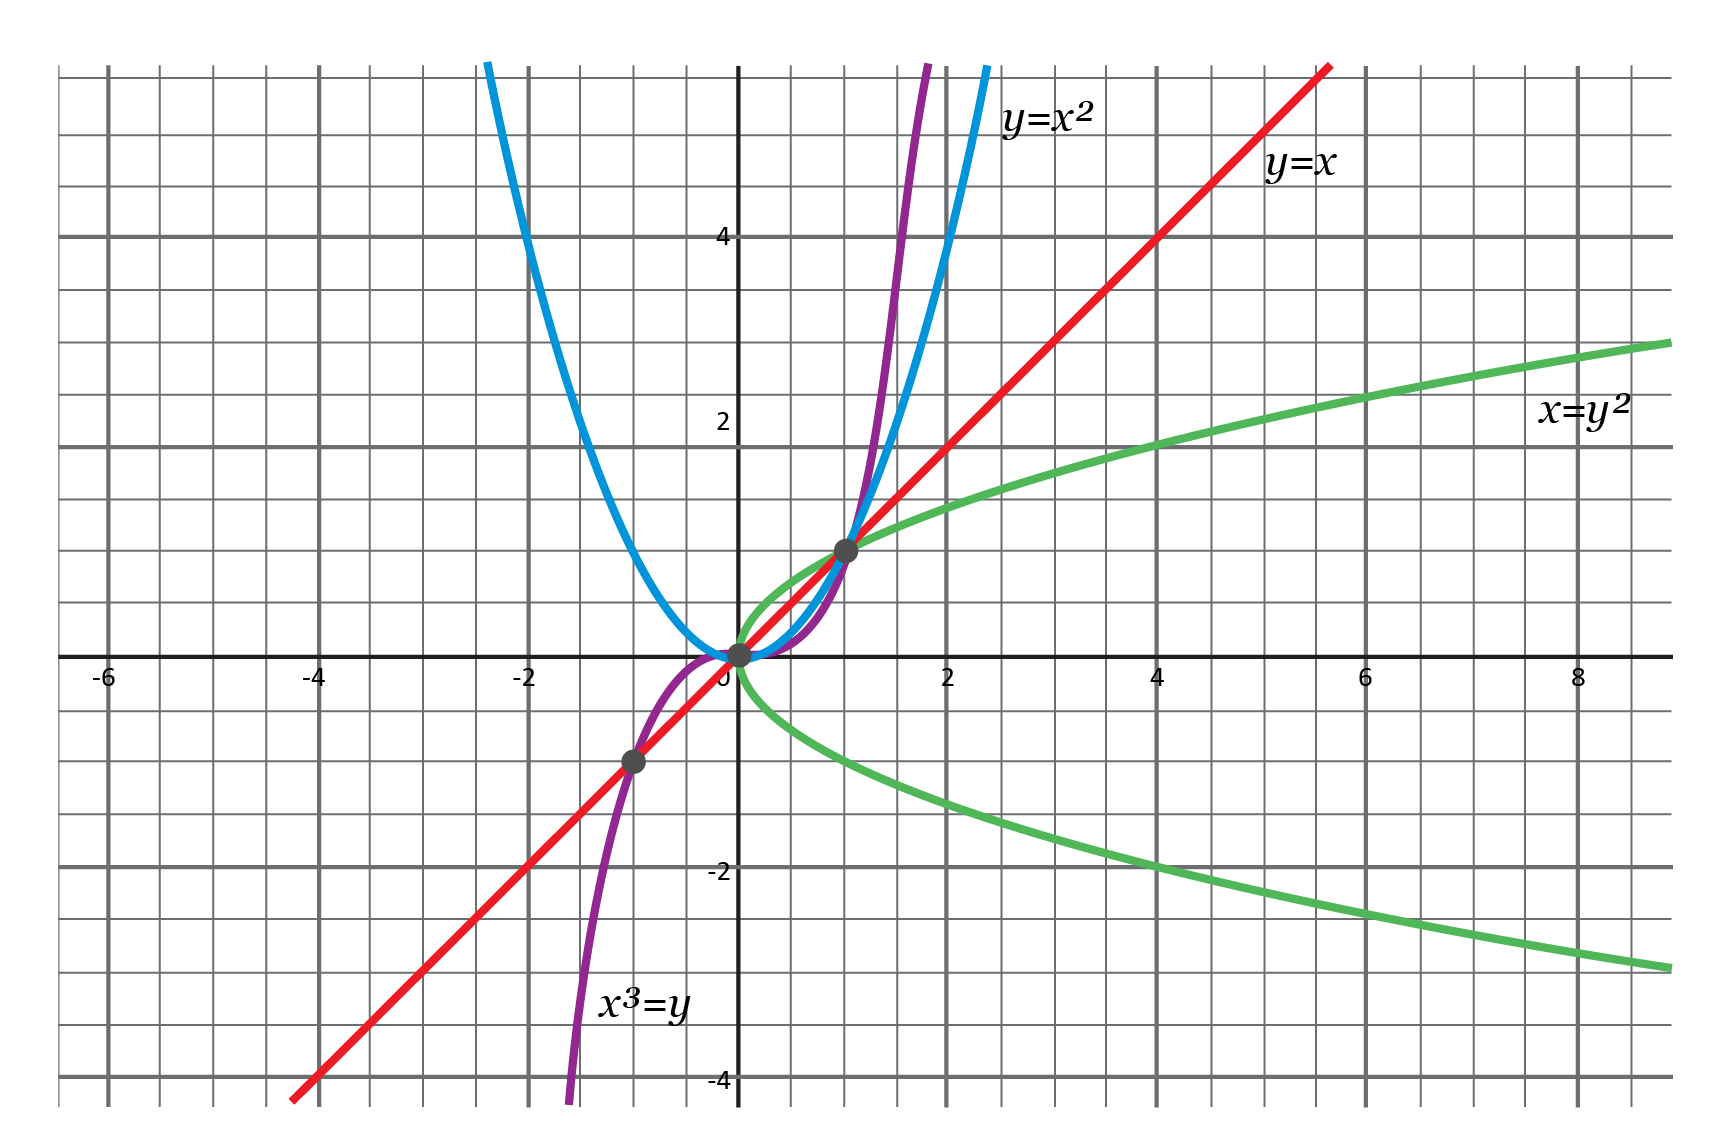
Which equation shows a relation that is NOT a function?
To see if the equations are a function, we can graph them and see if they pass the vertical line test. It is clear upon further examination that the only graph that does not pass the vertical line test is \(x=y^2\).
Which relation is a function?
| \(\mathbf{x}\) | \(\mathbf{y}\) |
|---|---|
| \(-2\) | \(-6\) |
| \(-1\) | \(-3\) |
| \(0\) | \(0\) |
| \(1\) | \(3\) |
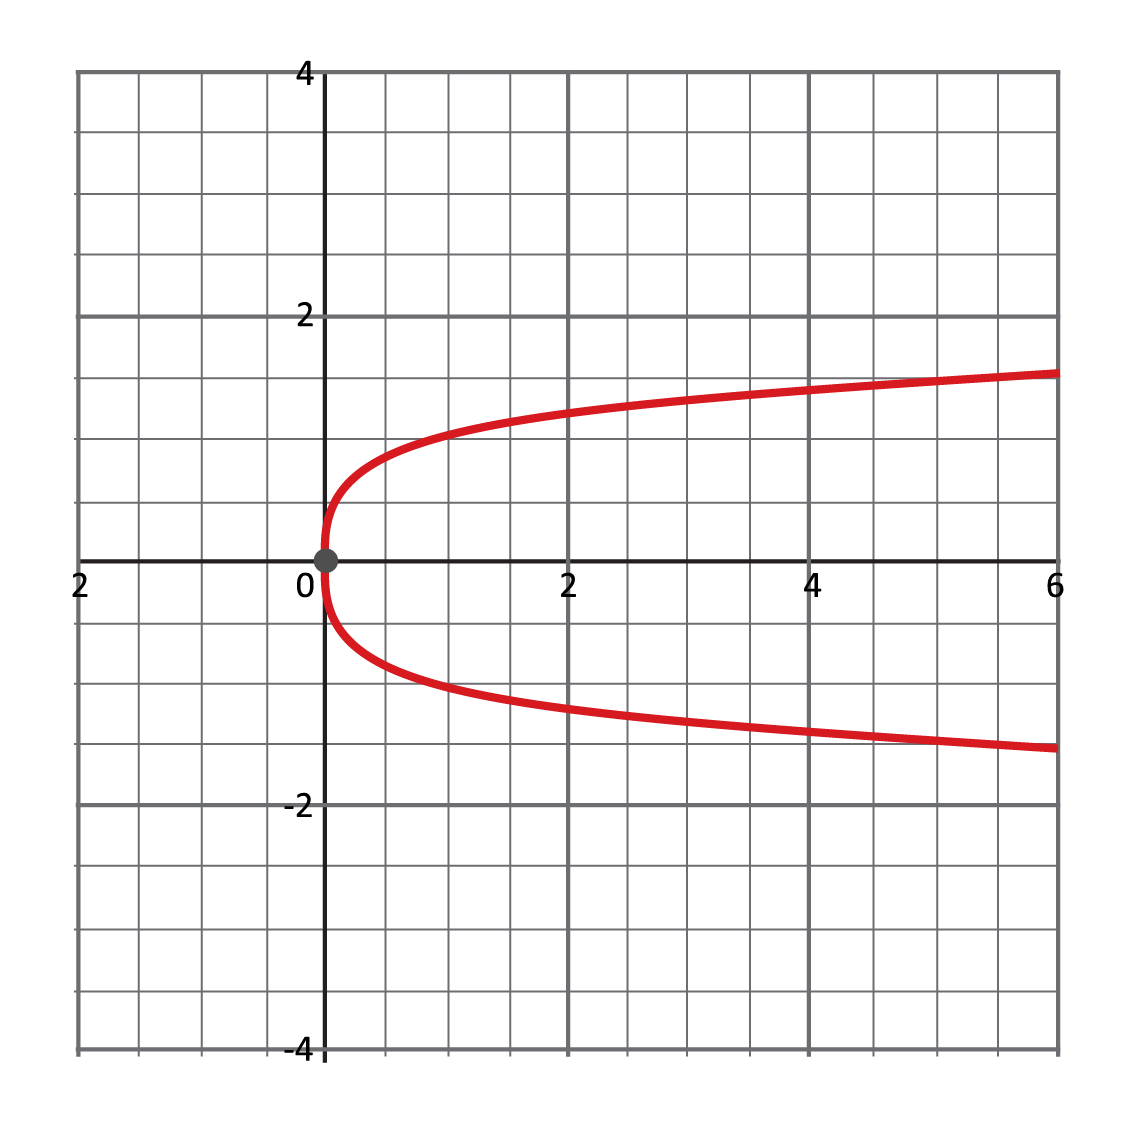
The graph of the equation in Choice A and the graph in Choice D are both sideways parabolas that fail the vertical line test. In Choice B, \(-1\) maps to both \(0\) and \(1\), which means it is not a function. Choice C is the only relation where each of the values of the domain maps to one unique value in the range.
Which table of values shows a relation that is a function?
| \(\mathbf{x}\) | \(\mathbf{y}\) |
|---|---|
| \(0\) | \(2\) |
| \(1\) | \(3\) |
| \(2\) | \(4\) |
| \(2\) | \(5\) |
| \(\mathbf{x}\) | \(\mathbf{y}\) |
|---|---|
| \(2\) | \(2\) |
| \(3\) | \(3\) |
| \(4\) | \(4\) |
| \(5\) | \(5\) |
| \(\mathbf{x}\) | \(\mathbf{y}\) |
|---|---|
| \(-1\) | \(4\) |
| \(-2\) | \(6\) |
| \(-2\) | \(-6\) |
| \(-1\) | \(-4\) |
| \(\mathbf{x}\) | \(\mathbf{y}\) |
|---|---|
| \(7\) | \(3\) |
| \(5\) | \(1\) |
| \(3\) | \(-1\) |
| \(7\) | \(-3\) |
To determine if the relation presented in the tables is a function, we look at the domain values (x-values) to see if they map to one unique range value. The only relation that meets this requirement is Choice B, where each value of the domain is mapped to a unique range value.
Which shows the graph of a function?
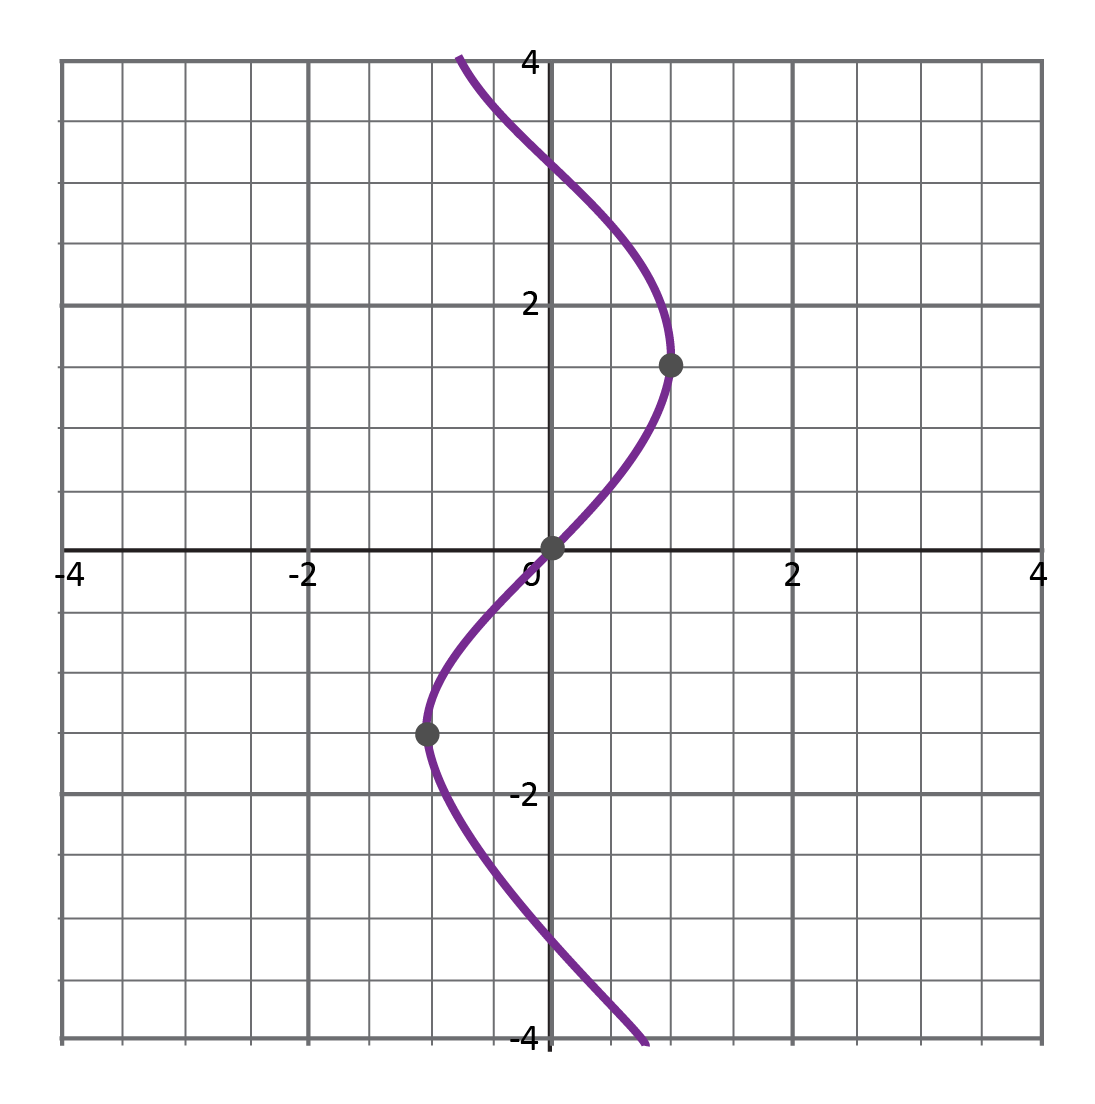
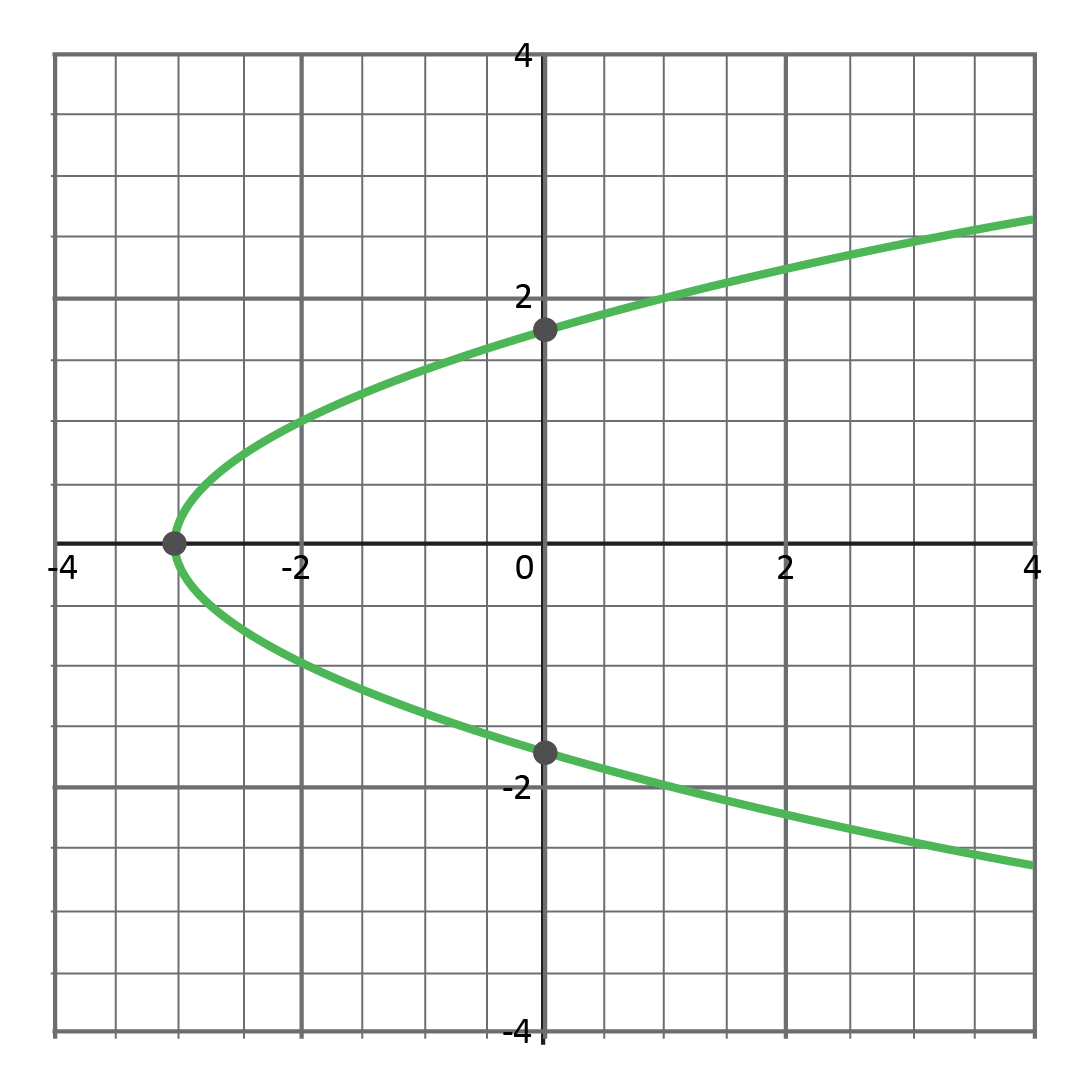
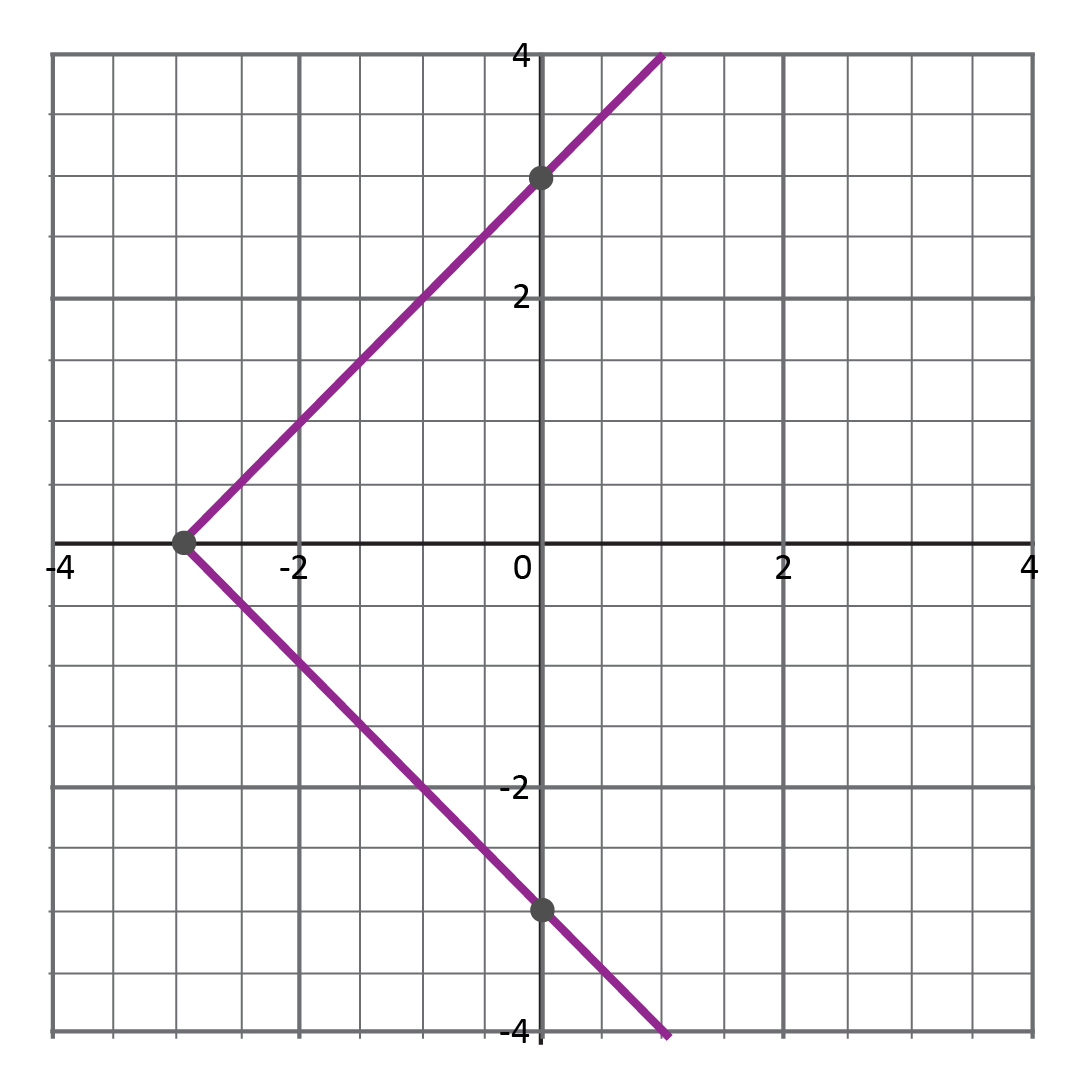
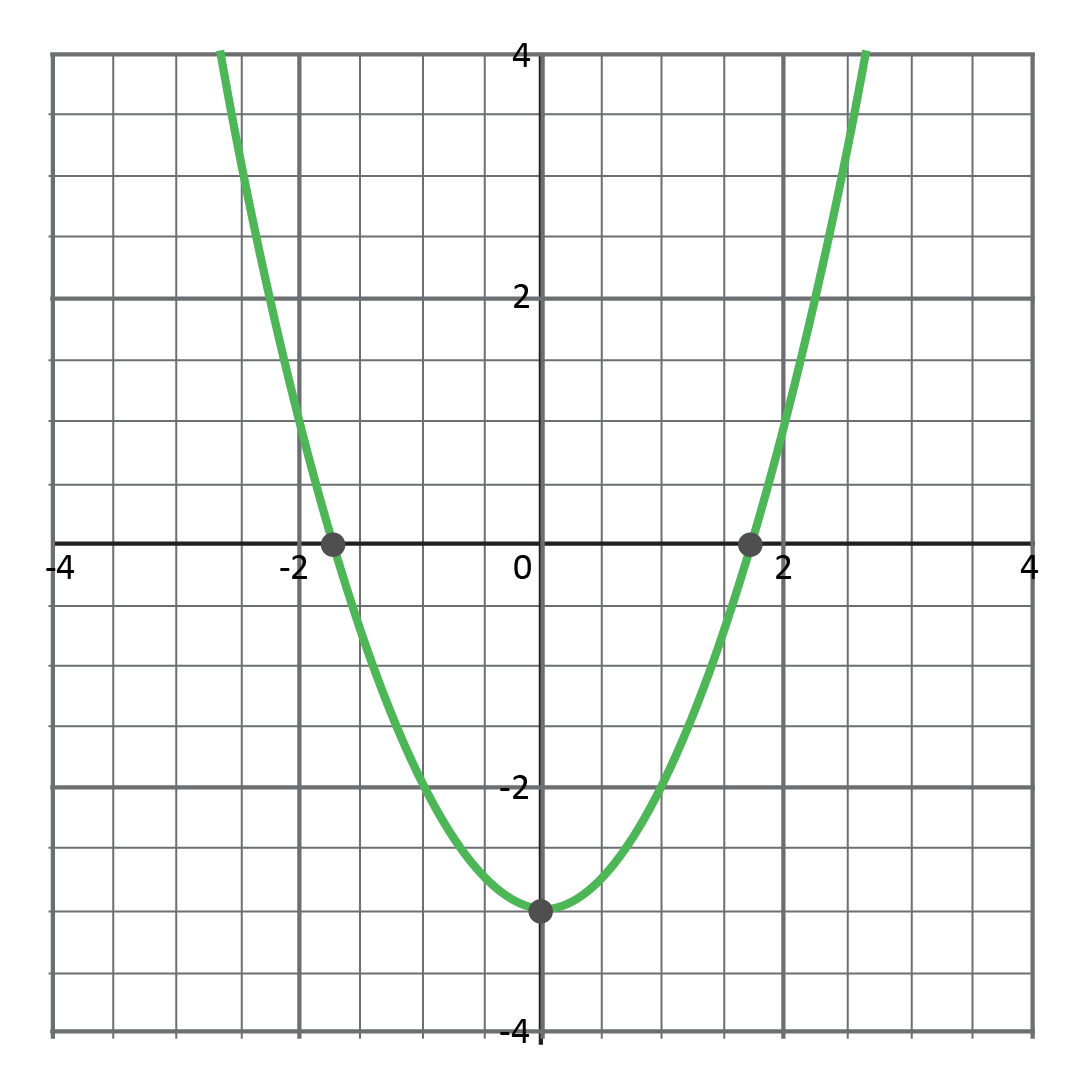
Since we have already been given the graphs of the relations, we can apply the vertical line test to determine which relation is a function. The only graph that passes the vertical line test is Choice D.
