Hello and welcome to this video about empirical probability! In this video, we will explore what empirical probability is, how empirical probability relates to theoretical probability, and how empirical probability can be used.
Key Concepts
Let’s use a standard number cube to introduce some of the key concepts related to empirical probability.
A standard number cube has 6 sides, numbered 1-6. The weight is equally distributed, and the sides are the same size, so the theoretical probability of rolling any number is 1 out of 6, as illustrated here:
| Outcome | Probability |
|---|---|
| 1 | 1/6 |
| 2 | 1/6 |
| 3 | 1/6 |
| 4 | 1/6 |
| 5 | 1/6 |
| 6 | 1/6 |
The theoretical probability of rolling any number is 1 out of 6 because there are 6 equally possible, independent outcomes every time the number cube is rolled. In theory, after, say, 96 rolls, each number should be rolled 16 times.
So you grab a number cube and start rolling, but your outcomes look like this:
| Outcome | Probability |
|---|---|
| 1 | 13/96 |
| 2 | 7/96 |
| 3 | 15/96 |
| 4 | 27/96 |
| 5 | 31/96 |
| 6 | 3/96 |
Clearly, these outcomes didn’t match their theoretical probabilities. Why?
Theoretical vs. Empirical
Theoretical probability simply states the likelihood of an outcome of an event, but it does not state what must happen. The frequencies of the outcomes you rolled are your empirical probabilities (also called experimental probabilities).
If you rolled the number cube a 97th time, you might predict an outcome of a 4 or a 5 because the combined empirical probabilities of these two outcomes are 27 out of 96 plus 31 out of 96, equals 58 out of 96.
This illustrates the key distinction between theoretical probability and empirical probability. Theoretical probability of an event can be calculated without actually doing the event. There are 6 possible outcomes of rolling a number cube, so each outcome has a theoretical probability of 1 out of 6. There are 4 aces in a deck of cards, so the probability of randomly drawing an ace is 4 out of 52. On a standard dartboard, the area of the double bullseye in the center is 0.078% of the area of the dartboard, so the probability of a double bullseye is about 78 out 100,000.
On the other hand, empirical probability uses the frequencies of outcomes to determine the likelihoods of future outcomes. They are just estimates. When you rolled the number cube, 4s and 5s are what you rolled most, so the empirical probability of rolling a 4 or a 5 on the next roll is 58 out of 96.
It’s also important to note that theoretical probabilities don’t change. The theoretical probability of rolling any number on the number cube is always 1 out of 6. Suppose you decide to try the experiment again the next day and get these results:
| Outcome | Probability |
|---|---|
| 1 | 43/96 |
| 2 | 13/96 |
| 3 | 15/96 |
| 4 | 4/96 |
| 5 | 22/96 |
| 6 | 11/96 |
The empirical probabilities here are very different and you might come to a different conclusion than in the first round.
Combining the results of the two experiments might lead to a third way of thinking:
| Outcome | Probability |
|---|---|
| 1 | 56/192 |
| 2 | 20/192 |
| 3 | 18/192 |
| 4 | 18/192 |
| 5 | 53/192 |
| 6 | 14/192 |
This emphasizes the use of empirical probability as simply a gauge. Knowing some past outcomes can help guide in predicting future outcomes. Again, empirical probabilities are just estimates. In this case, the differences in the outcomes reinforce the fact that rolling a number cube is an independent event and that any outcome has an equal probability of occurring.
Of course, according to the Law of Large Numbers, if you rolled the number cube 1,000 or 10,000 times, the empirical probabilities would start to more closely resemble the theoretical probabilities.
So we’ve talked about the numbers you rolled the most. What about the number you rolled the least? Over 192 rolls, 6 was rolled the least. That doesn’t mean that you are “due” for a 6 soon. The probability of rolling a 6 is still 1 out of 6 and the event is still independent. In other words, the theoretical probability does not become higher on the 193rd roll because the empirical probability from the previous 192 rolls is low.
When meteorologists predict the weather, they are largely using empirical probabilities. When a weatherman says there is a 70% chance of rain tomorrow, that number isn’t arbitrary. Part of what it means is that certain weather conditions are expected tomorrow that could lead to rain. Historically, when similar conditions have been present, it has rained about 70% of the time. The likelihood of the outcome of a future event is based on the outcomes of similar past events.
I hope that this video increased your understanding of empirical probability and how it can be used!
See you next time!
Empirical Probability Practice Questions
Empirical Probability is also known as _____________.
Empirical probability is also referred to as experimental probability because it is based on an actual experiment. Experiments do not have fixed results, so the outcomes may vary. For example, the theoretical probability of a flipped coin landing on heads is \(\frac{1}{2}\). However, when an actual experiment is conducted, tails could be flipped five out of five times. Empirical probability, or experimental probability, is based on the data produced from an experiment, which does not always match the theoretical probability for the scenario.
True or False:
Over time, as an experiment is conducted multiple times, the empirical probability should start to closely resemble the theoretical probability.
The theoretical probability never changes. For example, the theoretical probability of rolling a three on a number cube is always \(\frac{1}{6}\). However, in a real trial, a three may only be rolled two times out of twenty rolls, which represents an empirical probability of \(\frac{2}{20}\) or \(\frac{1}{10}\). In theory, if the number cube is rolled more times, say 100 times or 1,000 times, the empirical probability should become closer and closer to the theoretical probability of \(\frac{1}{6}\). This is known as The Law of Large Numbers.
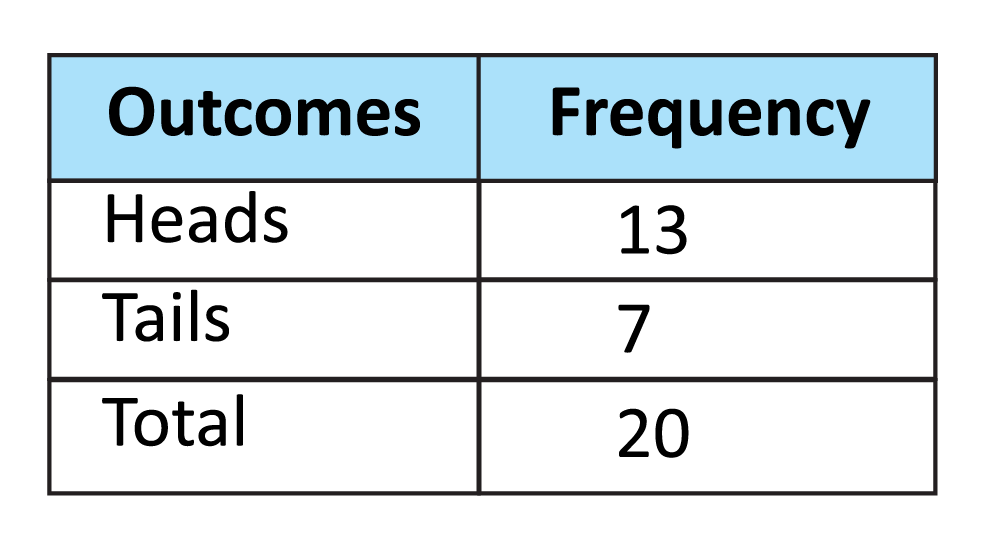
Jesse runs a coin flipping experiment. He knows that the theoretical probability of flipping heads or tails should be \(\frac{1}{2}\), but his experiment does not produce this result. In Jesse’s experiment, what was the empirical probability of flipping heads and flipping tails?

The empirical probability is the probability that comes from performing an experiment. Jesse flipped heads 13 out of 20 times, so his empirical probability of flipping heads is \(\frac{13}{20}\). He flipped tails 7 out of 20 times, so his empirical probability of flipping tails is \(\frac{7}{20}\).
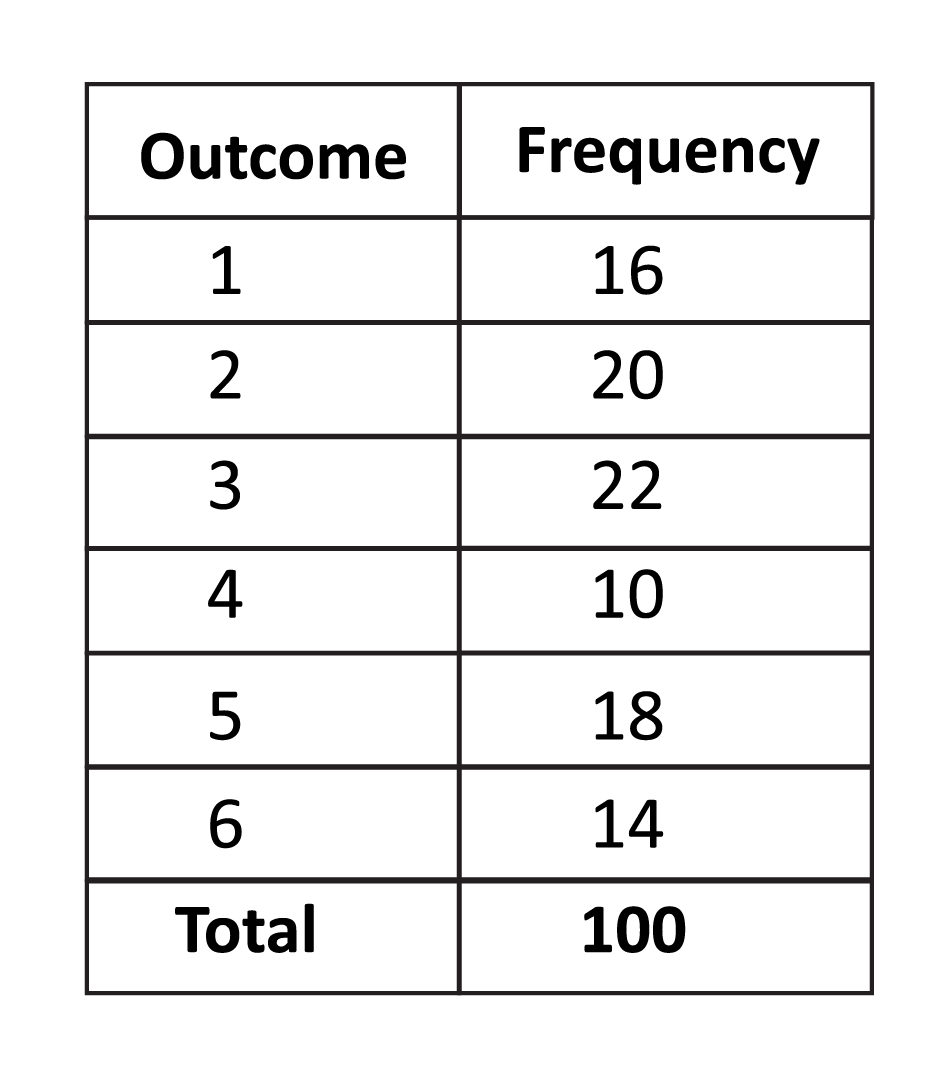
What was the empirical probability of rolling an even number on the number cube in the following experiment?

The number cube was rolled 100 times in this experiment. The 2 was rolled 20 times \((\frac{20}{100})\), the 4 was rolled 10 times \((\frac{10}{100})\), and the 6 was rolled 14 times \((\frac{14}{100})\). An even number was rolled \(20+10+14\) times, so 44 times. 44 out of 100 rolls landed on an even number, which is 44%.
Thomas is conducting an experiment to determine the probability of drawing a purple marble out of the bag. He randomly selects a marble 20 times, and replaces the marble after each selection. His results are listed below.
Red: 4
Green: 6
Blue: 3
Purple: 7

How does the empirical probability of drawing a purple compare to the theoretical probability of drawing a purple?
The theoretical probability of selecting a purple is 2 out of 11, or \(\frac{2}{11}\). However, when Thomas runs the experiment, he selects purple 7 out 20 times, or \(\frac{7}{20}\). This is 1.925, or approximately 2, times higher than the theoretical probability. If Thomas was to run the experiment with more trials, say 100 times, or 1,000 times, his probability of drawing a purple would become closer and closer to \(\frac{2}{11}\).